• Photonics Research
  • Vol. 11, Issue 3, 442 (2023)
Yao Fan1、2、3, Jiasong Sun1、2、3, Yefeng Shu1、2、3, Zeyu Zhang1、2、3, Qian Chen1、2、3、4、*, and Chao Zuo1、2、3、5、*
Author Affiliations
  • 1Smart Computational Imaging (SCI) Laboratory, Nanjing University of Science and Technology, Nanjing 210094, China
  • 2Smart Computational Imaging Research Institute (SCIRI) of Nanjing University of Science and Technology, Nanjing 210019, China
  • 3Jiangsu Key Laboratory of Spectral Imaging & Intelligent Sense, Nanjing University of Science and Technology, Nanjing 210094, China
  • 4e-mail: chenqian@njust.edu.cn
  • 5e-mail: zuochao@njust.edu.cn
  • show less
    DOI: 10.1364/PRJ.476170 Cite this Article Set citation alerts
    Yao Fan, Jiasong Sun, Yefeng Shu, Zeyu Zhang, Qian Chen, Chao Zuo. Accurate quantitative phase imaging by differential phase contrast with partially coherent illumination: beyond weak object approximation[J]. Photonics Research, 2023, 11(3): 442 Copy Citation Text show less
    Simulation and comparison of ideal intensity model and weak object approximation intensity model under different illumination coefficients. (a) Ground-truth amplitude and phase images of the complex transmittance function used to simulate the sample. (b) Spectrum distribution of the theoretical sample distribution ejϕ(x) and linear distribution 1+jϕ(x). (c) Different illumination coefficients. (d) Intensity difference images at different illumination coefficients sill. (e) RMSE values of the intensities under two sample models with varying illumination coefficients. (f) 3D profile of the reconstructed phase error at sill=1.
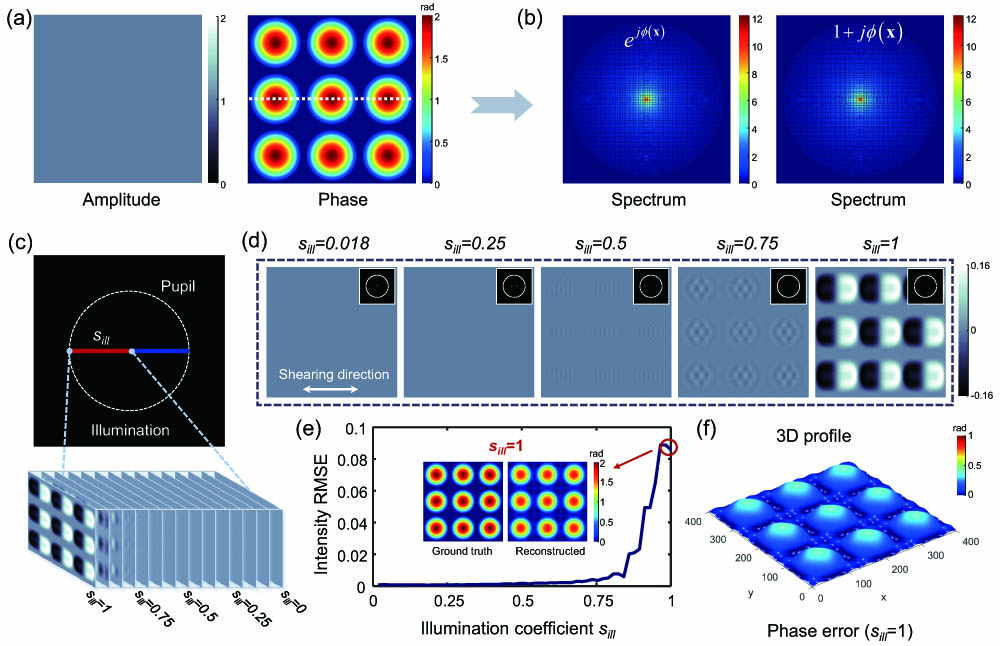
    Fig. 1. Simulation and comparison of ideal intensity model and weak object approximation intensity model under different illumination coefficients. (a) Ground-truth amplitude and phase images of the complex transmittance function used to simulate the sample. (b) Spectrum distribution of the theoretical sample distribution ejϕ(x) and linear distribution 1+jϕ(x). (c) Different illumination coefficients. (d) Intensity difference images at different illumination coefficients sill. (e) RMSE values of the intensities under two sample models with varying illumination coefficients. (f) 3D profile of the reconstructed phase error at sill=1.
    Numerical simulation results with variable phase to determine the definition of the strict weak object approximation. (a) Illumination apertures and their corresponding WPTFs. (b), (c) RMSE curves for the reconstructed phase of a microlens array and a sharply varying step with increasing phase values under different illumination apertures. (d), (e) Reconstructed phase and its profile for different phase values of a microlens array and a sharply varying step under half-annular illumination of 0.01 width.
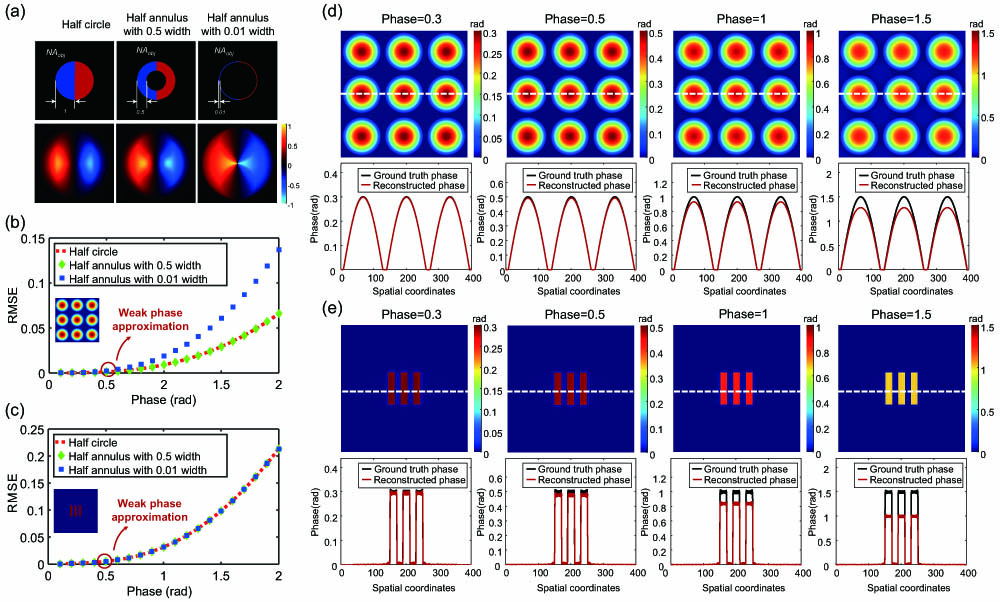
    Fig. 2. Numerical simulation results with variable phase to determine the definition of the strict weak object approximation. (a) Illumination apertures and their corresponding WPTFs. (b), (c) RMSE curves for the reconstructed phase of a microlens array and a sharply varying step with increasing phase values under different illumination apertures. (d), (e) Reconstructed phase and its profile for different phase values of a microlens array and a sharply varying step under half-annular illumination of 0.01 width.
    Algorithm flow chart of the iterative deconvolution reconstruction.
    Fig. 3. Algorithm flow chart of the iterative deconvolution reconstruction.
    Simulation results of one-step deconvolution and iterative deconvolution for large-phase samples with different illumination apertures. (a), (b) Comparison of phase results for reconstruction by two methods under half-circular illumination aperture and annular illumination aperture.
    Fig. 4. Simulation results of one-step deconvolution and iterative deconvolution for large-phase samples with different illumination apertures. (a), (b) Comparison of phase results for reconstruction by two methods under half-circular illumination aperture and annular illumination aperture.
    Experiment results on a standard microlens array sample (SUSS, Microoptics, RI of 1.46) with a curvature radius of 350 μm and a pitch of 250 μm. (a1), (a2) Asymmetrical illumination patterns. (b1), (b2) Differential intensity images along different shearing directions. (c) Variation curve of the intensity error. (d1) and (d2), (e1) and (e2) Reconstructed phases and their ROI under one-step deconvolution and iterative deconvolution. (f1) and (f2) 3D pseudo-color morphological distribution. (g1) and (g2) Quantitative phase values along the white dashed.
    Fig. 5. Experiment results on a standard microlens array sample (SUSS, Microoptics, RI of 1.46) with a curvature radius of 350 μm and a pitch of 250 μm. (a1), (a2) Asymmetrical illumination patterns. (b1), (b2) Differential intensity images along different shearing directions. (c) Variation curve of the intensity error. (d1) and (d2), (e1) and (e2) Reconstructed phases and their ROI under one-step deconvolution and iterative deconvolution. (f1) and (f2) 3D pseudo-color morphological distribution. (g1) and (g2) Quantitative phase values along the white dashed.
    Experiment results on MCF-7 human breast cancer cells. (a) FOV reconstructed phase under the iterative deconvolution. (b), (c) Phase values along the white dashed line. (d1)–(g1), (d2)–(g2) Enlarged images of the four ROIs under one-step deconvolution and iterative deconvolution. (h) 3D display of reconstruction results and the quantitative phase profiles.
    Fig. 6. Experiment results on MCF-7 human breast cancer cells. (a) FOV reconstructed phase under the iterative deconvolution. (b), (c) Phase values along the white dashed line. (d1)–(g1), (d2)–(g2) Enlarged images of the four ROIs under one-step deconvolution and iterative deconvolution. (h) 3D display of reconstruction results and the quantitative phase profiles.
    Simulation of one-step deconvolution reconstruction under half-circular illumination. (a), (b) Ground-truth amplitude and phase images of the complex transmittance function used to simulate the sample. (c), (d) WPTF and synthetic WPTF. (e1), (f1) Spectrum of the theoretical sample distribution ejϕ(x) and linear distribution 1+jϕ(x). (e2), (f2) Phase gradient images along the left-right shearing direction. (e3), (f3) Reconstructed phases. (g) Quantitative profiles of reconstructed phase and truth phase.
    Fig. 7. Simulation of one-step deconvolution reconstruction under half-circular illumination. (a), (b) Ground-truth amplitude and phase images of the complex transmittance function used to simulate the sample. (c), (d) WPTF and synthetic WPTF. (e1), (f1) Spectrum of the theoretical sample distribution ejϕ(x) and linear distribution 1+jϕ(x). (e2), (f2) Phase gradient images along the left-right shearing direction. (e3), (f3) Reconstructed phases. (g) Quantitative profiles of reconstructed phase and truth phase.
    Simulation of one-step deconvolution reconstruction under half-annular illumination. (a), (b) Ground-truth amplitude and phase images of the complex transmittance function used to simulate the sample. (c), (d) WPTF and synthetic WPTF. (e1), (f1) Spectrum of the theoretical sample distribution ejϕ(x) and linear distribution 1+jϕ(x). (e2), (f2) Phase gradient images along the left-right shearing direction. (e3), (f3) Reconstructed phases. (g) Quantitative profiles of the reconstructed phase and truth phase.
    Fig. 8. Simulation of one-step deconvolution reconstruction under half-annular illumination. (a), (b) Ground-truth amplitude and phase images of the complex transmittance function used to simulate the sample. (c), (d) WPTF and synthetic WPTF. (e1), (f1) Spectrum of the theoretical sample distribution ejϕ(x) and linear distribution 1+jϕ(x). (e2), (f2) Phase gradient images along the left-right shearing direction. (e3), (f3) Reconstructed phases. (g) Quantitative profiles of the reconstructed phase and truth phase.
    Yao Fan, Jiasong Sun, Yefeng Shu, Zeyu Zhang, Qian Chen, Chao Zuo. Accurate quantitative phase imaging by differential phase contrast with partially coherent illumination: beyond weak object approximation[J]. Photonics Research, 2023, 11(3): 442
    Download Citation