- Journal of Inorganic Materials
- Vol. 37, Issue 4, 436 (2022)
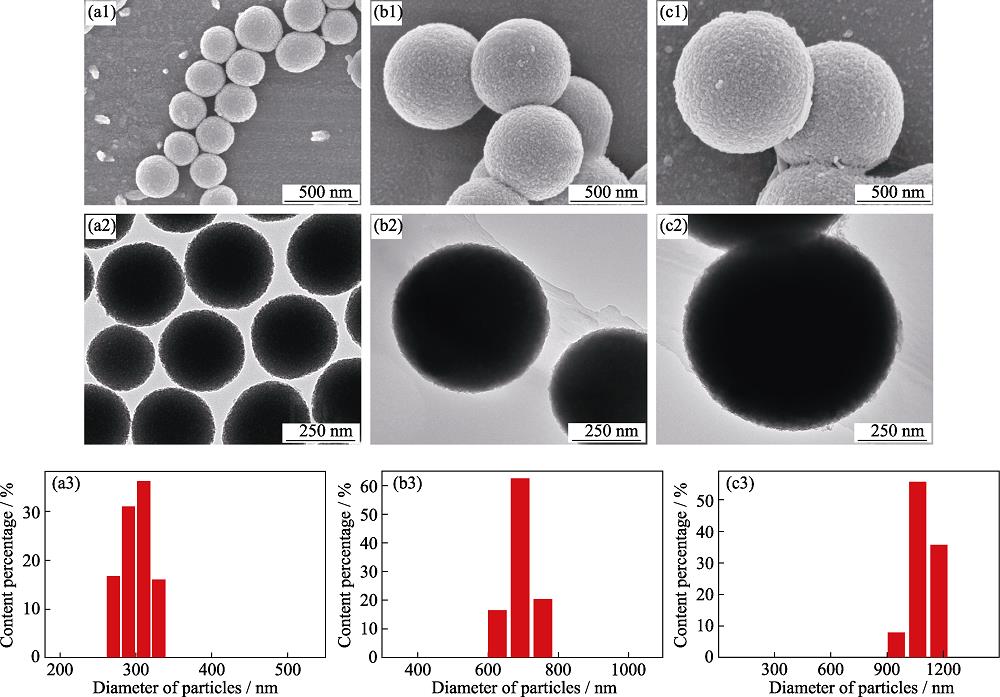
1. SEM (a1-c1), TEM (a2-c2) images and particle size distributions (a3-c3) of MNBGs
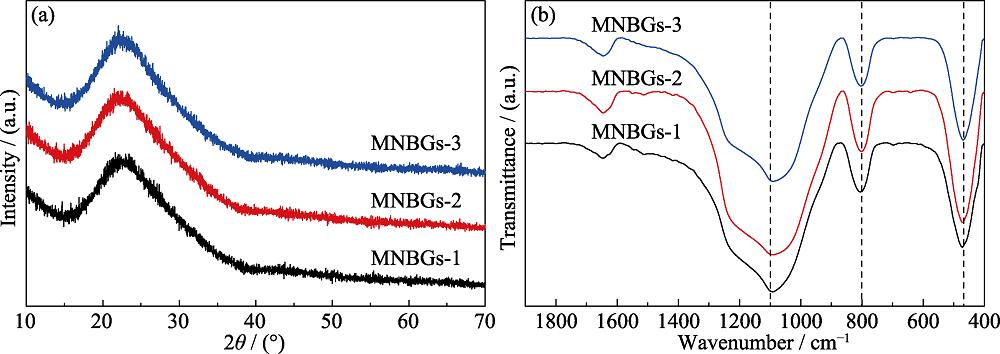
2. XRD patterns (a) and FT-IR spectra (b) of MNBGs
3. SEM images of the dentin surface without (a) and with (b) EDTA-etching, magnified photo of dentin tubules (insert in (b)), and photo of bioactive glass paste (c)
4. SEM images of demineralized dentin slices coating with different MNBGP
5. ATR-FTIR spectra of demineralized dentin surface before and after coating with MNBGP, and after rinsing with water
6. SEM images of the surfaces of demineralized dentin slices without (a) (control) and with treatment by MNBGP-1 (b), MNBGP-2 (c), and MNBGP-3 (d) after soaking in AS for 1 d (a1-d1), 7 d (a2-d2), 14 d (a3-d3) and 28 d (a4-d4)
7. SEM images of the longitudinal section of demineralized dentin samples without (a) (control) and with treatment by MNBGP-1 (b), MNBGP-2 (c), and MNBGP-3 (d) after soaking in AS for 1 d (a1-d1), 7 d (a2-d2), 14 d (a3-d3) and 28 d (a4-d4)
8. EDS analyses of the surface of demineralized dentin slices without (a) (control) and with treatment by MNBGP-1 (b), MNBGP-2 (c), and MNBGP-3 (d) after soaking in AS for 28 d
9. XRD patterns of the surface of intact dentin, demineralized dentin and slices without treatment (control) and being treated with MNBGP after being soaked in AS for 28 d
| ||||||||||||||||||||
Table 1. Theoretical and measured chemical composition, reagent dosage of MNBGs with different particle sizes
|
Table 2. Chemical components (molar percent) and Ca/P ratio on the surface of dentin before and after EDTA etching
|
Table 3. Chemical components ( molar percent) and Ca/P ratio in molar on the surface of remineralized dentin

Download Citation


Set citation alerts for the article
Please enter your email address

© Copyright 2018-2021 | Chinese Laser Press. All Rights Reserved 沪ICP备15018463号-20