• Chinese Optics Letters
  • Vol. 14, Issue 12, 123202 (2016)
Haiying Song, Yanjie Zhang, Xiangming Dong, and Shibing Liu*
Author Affiliations
  • Strong-Field and Ultrafast Photonics Lab, Institute of Laser Engineering, Beijing University of Technology, Beijing 100124, China
  • show less
    DOI: 10.3788/COL201614.123202 Cite this Article Set citation alerts
    Haiying Song, Yanjie Zhang, Xiangming Dong, Shibing Liu. Subwavelength ripple formation on planar and nonplanar surfaces by femtosecond laser scanning[J]. Chinese Optics Letters, 2016, 14(12): 123202 Copy Citation Text show less
    Schematic diagram for fs-laser scanning on a planar target in the experiment.
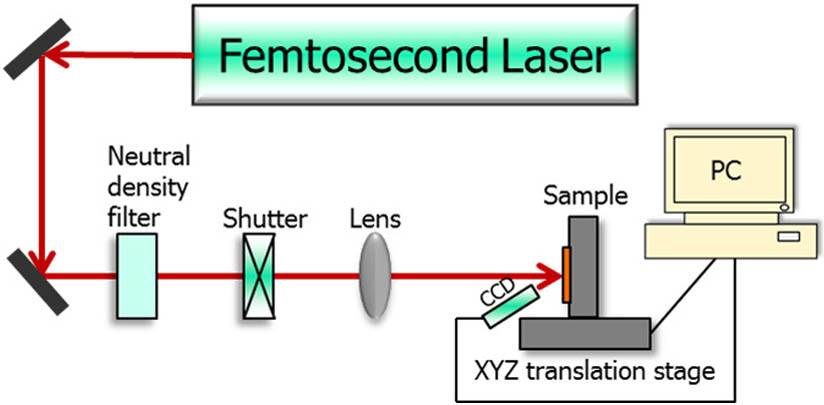
    Fig. 1. Schematic diagram for fs-laser scanning on a planar target in the experiment.
    SEM images of grating structures on a W metal target induced by a fs-laser with wavelengths of (a) λ0=400 nm and (b) λ0=800 nm.
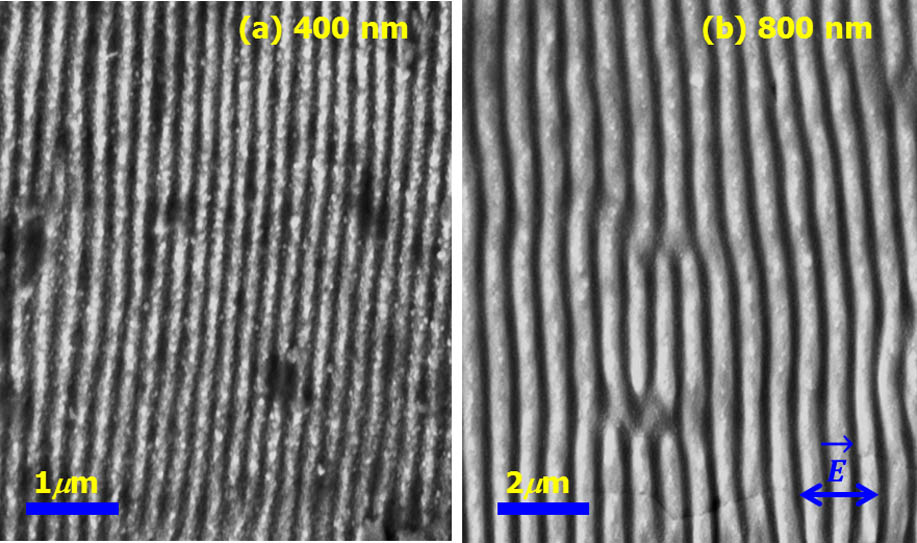
    Fig. 2. SEM images of grating structures on a W metal target induced by a fs-laser with wavelengths of (a) λ0=400nm and (b) λ0=800nm.
    SEM images of grating structures formed by an 800 nm wavelength laser with an energy fluence FL=1.2 J/cm2 at scanning speeds of (a) v=0.94 mm/s, (b) v=1.25 mm/s, (c) v=1.56 mm/s, and (d) v=1.88 mm/s, respectively.
    Fig. 3. SEM images of grating structures formed by an 800 nm wavelength laser with an energy fluence FL=1.2J/cm2 at scanning speeds of (a) v=0.94mm/s, (b) v=1.25mm/s, (c) v=1.56mm/s, and (d) v=1.88mm/s, respectively.
    Ablation depth of gratings versus the laser scanning speed for an 800 nm wavelength and 1.2 J/cm2 experiment, where the red dashed line is the corresponding fitted curve and the depth change measured by an AFM at a constant scanning speed and the laser fluence is inserted at top right corner.
    Fig. 4. Ablation depth of gratings versus the laser scanning speed for an 800 nm wavelength and 1.2J/cm2 experiment, where the red dashed line is the corresponding fitted curve and the depth change measured by an AFM at a constant scanning speed and the laser fluence is inserted at top right corner.
    SEM images of grating structures formed by a 800 nm wavelength laser at the scanning speed of 1.25 mm/s with energy fluences of (a) 1.2 J/cm2, (b) 1.4 J/cm2, (c) 1.6 J/cm2, and (d) 1.8 J/cm2.
    Fig. 5. SEM images of grating structures formed by a 800 nm wavelength laser at the scanning speed of 1.25 mm/s with energy fluences of (a) 1.2J/cm2, (b) 1.4J/cm2, (c) 1.6J/cm2, and (d) 1.8J/cm2.
    Ablation depth of gratings versus the laser fluence for a 800 nm laser wavelength and 1.25 mm/s scanning speed. The meanings of the other curves and symbols are analogous to Fig. 4.
    Fig. 6. Ablation depth of gratings versus the laser fluence for a 800 nm laser wavelength and 1.25 mm/s scanning speed. The meanings of the other curves and symbols are analogous to Fig. 4.
    (a) Schematic diagram for grating structure fabrication by laser scanning, where the blue area is the zone formed by single-pass laser scanning and the saffron yellow area is the overlapped zone due to back and forth laser scanning. The SEM images are grating structures obtained in different scanning zones by (b) single-pass scanning, (c) back and forth scanning with a gap between scanning beams, and (d) back and forth scanning with a 10 μm overlap between scanning beams.
    Fig. 7. (a) Schematic diagram for grating structure fabrication by laser scanning, where the blue area is the zone formed by single-pass laser scanning and the saffron yellow area is the overlapped zone due to back and forth laser scanning. The SEM images are grating structures obtained in different scanning zones by (b) single-pass scanning, (c) back and forth scanning with a gap between scanning beams, and (d) back and forth scanning with a 10 μm overlap between scanning beams.
    (a) Schematic diagram for grating structure fabrication by laser scanning circle-by-circle, where the blue area is the zone formed by single-pass scanning and the saffron yellow area is the zone overlapped by two scanning circles, (b) the scanned cylindrical target with a radius of 5 mm on which the grating effect appears, and (c) and (d) the SEM images of self-formed grating structures in the zone overlapped by two scanning circles.
    Fig. 8. (a) Schematic diagram for grating structure fabrication by laser scanning circle-by-circle, where the blue area is the zone formed by single-pass scanning and the saffron yellow area is the zone overlapped by two scanning circles, (b) the scanned cylindrical target with a radius of 5 mm on which the grating effect appears, and (c) and (d) the SEM images of self-formed grating structures in the zone overlapped by two scanning circles.
    Schematic diagram for the self-formation of ripple structures on a nonplanar surface by a fs-laser pulse.
    Fig. 9. Schematic diagram for the self-formation of ripple structures on a nonplanar surface by a fs-laser pulse.
    Haiying Song, Yanjie Zhang, Xiangming Dong, Shibing Liu. Subwavelength ripple formation on planar and nonplanar surfaces by femtosecond laser scanning[J]. Chinese Optics Letters, 2016, 14(12): 123202
    Download Citation