• Photonics Research
  • Vol. 6, Issue 2, 84 (2018)
F. Tani*, F. Köttig, D. Novoa, R. Keding, and P. St.J. Russell
Author Affiliations
  • Max Planck Institute for the Science of Light, Staudtstrasse 2, 91058 Erlangen, Germany
  • show less
    DOI: 10.1364/PRJ.6.000084 Cite this Article Set citation alerts
    F. Tani, F. Köttig, D. Novoa, R. Keding, P. St.J. Russell. Effect of anti-crossings with cladding resonances on ultrafast nonlinear dynamics in gas-filled photonic crystal fibers[J]. Photonics Research, 2018, 6(2): 84 Copy Citation Text show less
    Effective refractive index of the fundamental core mode of (e) an ideal kagomé-PCF and (f) an SR-PCF, calculated using FEM (blue dots), and with the capillary model given by Eq. (1) with R1=0 (orange-dashed line). Fitting the FEM data to Eq. (1) including the response function given by Eq. (1) (green-solid line) gives A1=3.5 THz, Γ1=10 THz for the kagomé-PCF (left) and A1=2.4 THz, Γ1=4.1 THz for the SR-PCF. (g), (h) Zoom into the anti-crossing. Both fibers are assumed to be evacuated. The red under-shaded trace shows the FEM-calculated fiber loss. Scanning electron micrographs of the fibers are shown as insets. The plots above show the FEM mode profiles at 1030 nm [off-resonance, (b), (d)] and at 610 and 700 nm [on-resonance, (a), (c)] for the kagomé-PCF (left) and SR-PCF (right).
    Fig. 1. Effective refractive index of the fundamental core mode of (e) an ideal kagomé-PCF and (f) an SR-PCF, calculated using FEM (blue dots), and with the capillary model given by Eq. (1) with R1=0 (orange-dashed line). Fitting the FEM data to Eq. (1) including the response function given by Eq. (1) (green-solid line) gives A1=3.5  THz, Γ1=10  THz for the kagomé-PCF (left) and A1=2.4  THz, Γ1=4.1  THz for the SR-PCF. (g), (h) Zoom into the anti-crossing. Both fibers are assumed to be evacuated. The red under-shaded trace shows the FEM-calculated fiber loss. Scanning electron micrographs of the fibers are shown as insets. The plots above show the FEM mode profiles at 1030 nm [off-resonance, (b), (d)] and at 610 and 700 nm [on-resonance, (a), (c)] for the kagomé-PCF (left) and SR-PCF (right).
    (a) FWM dephasing for the kagomé-PCF, filled with 35 bar Ne. The slanted black line indicates degeneracy (signal and idler frequencies equal to the pump frequency). (b) Dephasing to DWs calculated under the same conditions, for an ideal anti-crossing-free fiber (dashed orange) and the real fiber filled with Ne at 35 bar (green).
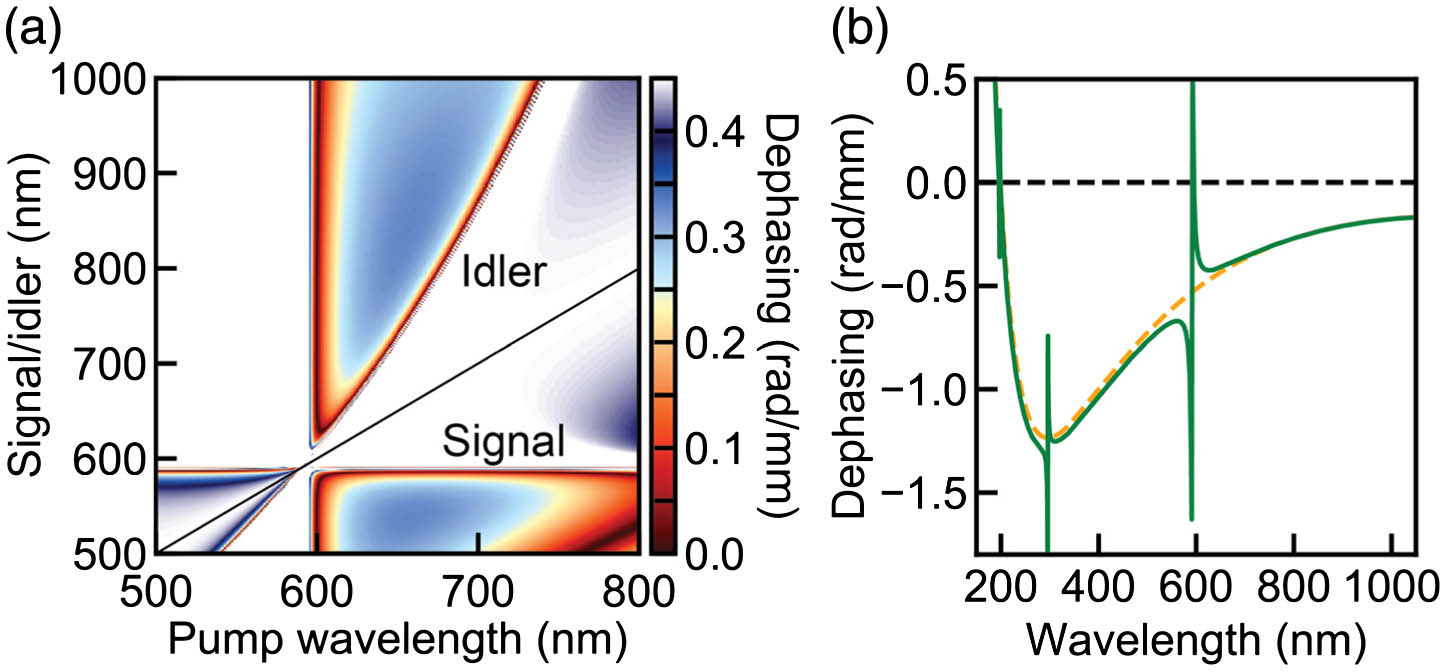
    Fig. 2. (a) FWM dephasing for the kagomé-PCF, filled with 35 bar Ne. The slanted black line indicates degeneracy (signal and idler frequencies equal to the pump frequency). (b) Dephasing to DWs calculated under the same conditions, for an ideal anti-crossing-free fiber (dashed orange) and the real fiber filled with Ne at 35 bar (green).
    (a) Measured and (b) simulated spectrum at the kagomé-PCF output. (c) Maximum peak intensity along the fiber normalized to the input intensity (red squares) and conversion efficiency to the UV DW (blue dots) as a function of the wavelength of the q=1 anti-crossing. The arrow points to the drop in the conversion efficiency to the DW, which is caused by the q=2 anti-crossing that coincides with the DW wavelength.
    Fig. 3. (a) Measured and (b) simulated spectrum at the kagomé-PCF output. (c) Maximum peak intensity along the fiber normalized to the input intensity (red squares) and conversion efficiency to the UV DW (blue dots) as a function of the wavelength of the q=1 anti-crossing. The arrow points to the drop in the conversion efficiency to the DW, which is caused by the q=2 anti-crossing that coincides with the DW wavelength.
    (a) Maximum peak intensity along the fiber as a function of Δξ for increasing N by incrementing the gas-filling pressure (the first number is N and the second the Ne pressure). Each data point is calculated for a 27 fs (FHWM) Gaussian pump pulse launched into the kagomé-PCF with pulse energy 6 μJ. Each curve is normalized to the peak intensity I0 at the fiber input. The black diamonds mark the points where each I/I0 curve has dropped below 90% of its maximum. (b) The I/I0 curves obtained keeping N constant and changing gas pressure and pulse energy: 6 μJ (red curve) and 11.5 μJ (orange curve). (c) Central wavelength of the q=1 anti-crossing as a function of Δξ [color-coding is the same as in (a)].
    Fig. 4. (a) Maximum peak intensity along the fiber as a function of Δξ for increasing N by incrementing the gas-filling pressure (the first number is N and the second the Ne pressure). Each data point is calculated for a 27 fs (FHWM) Gaussian pump pulse launched into the kagomé-PCF with pulse energy 6 μJ. Each curve is normalized to the peak intensity I0 at the fiber input. The black diamonds mark the points where each I/I0 curve has dropped below 90% of its maximum. (b) The I/I0 curves obtained keeping N constant and changing gas pressure and pulse energy: 6 μJ (red curve) and 11.5 μJ (orange curve). (c) Central wavelength of the q=1 anti-crossing as a function of Δξ [color-coding is the same as in (a)].
    (a) Effective refractive index of the fundamental core mode of the SR-PCF calculated via FEM (blue dots), for the original fiber (∼350 nm capillary-wall thickness) and (b) after etching (∼220 nm). The solid lines show the curves obtained by fitting the FEM data to Eq. (1), and the under-shaded curves plot the FEM-calculated fiber loss. Experimental output spectra at (c) 11.3 μJ input energy in the original fiber and (d) 9.7 μJ in the etched fiber.
    Fig. 5. (a) Effective refractive index of the fundamental core mode of the SR-PCF calculated via FEM (blue dots), for the original fiber (350  nm capillary-wall thickness) and (b) after etching (220  nm). The solid lines show the curves obtained by fitting the FEM data to Eq. (1), and the under-shaded curves plot the FEM-calculated fiber loss. Experimental output spectra at (c) 11.3 μJ input energy in the original fiber and (d) 9.7 μJ in the etched fiber.
    F. Tani, F. Köttig, D. Novoa, R. Keding, P. St.J. Russell. Effect of anti-crossings with cladding resonances on ultrafast nonlinear dynamics in gas-filled photonic crystal fibers[J]. Photonics Research, 2018, 6(2): 84
    Download Citation