
Yu-hui ZHAO, Xiao-dong LIU, Lei ZHANG, Yong-hong LIU. Research on Calibration Transfer Method Based on Joint Feature Subspace Distribution Alignment[J]. Spectroscopy and Spectral Analysis, 2021, 41(11): 3411
- Spectroscopy and Spectral Analysis
- Vol. 41, Issue 11, 3411 (2021)
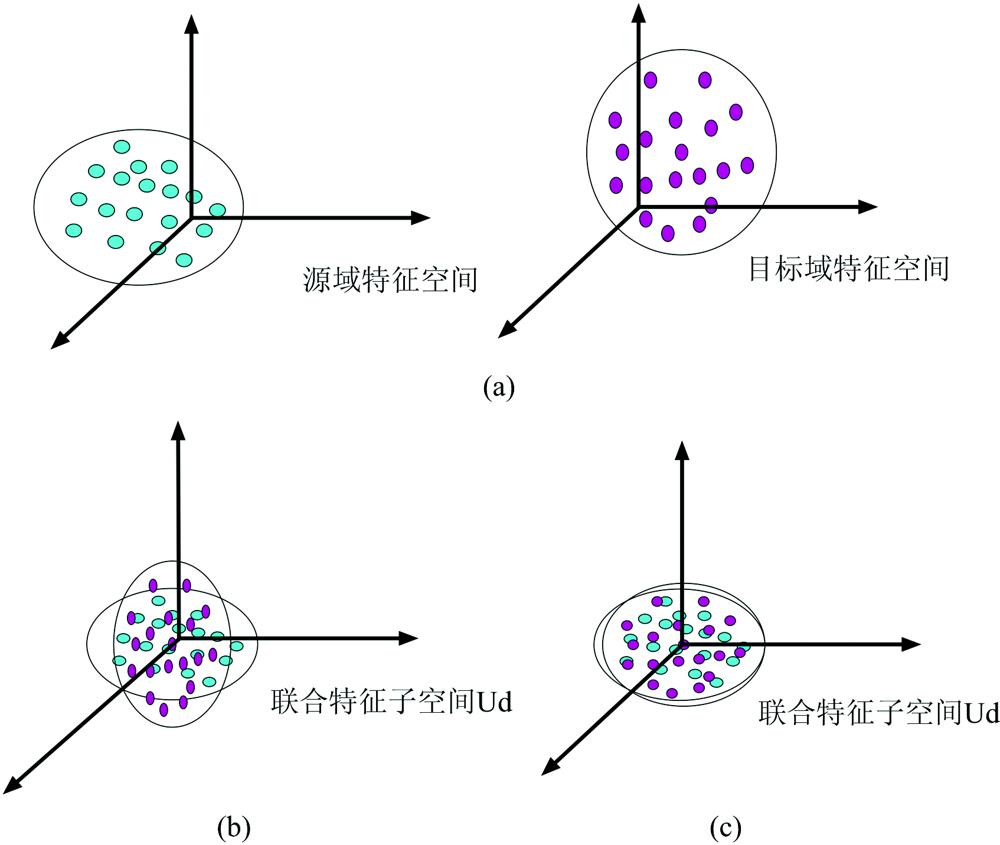
Fig. 1. Feature distribution alignment diagram
(a): Original; (b): Mean correction; (c): Covariance correction
(a): Original; (b): Mean correction; (c): Covariance correction
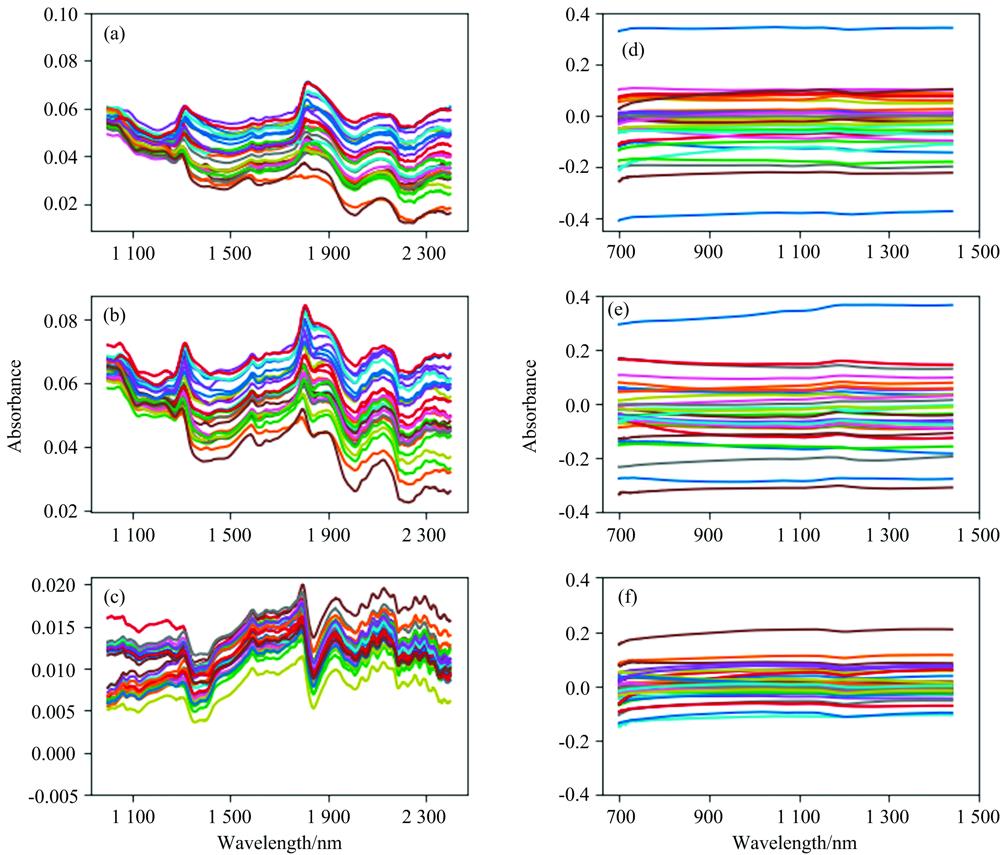
Fig. 2. Spectral differences between different instruments
Fig. 3. Scatter plots of prediction comparison between instruments M5 and MP5 using JSDA, SBC, PDS, CCACT, MSC, TCR
Fig. 4. Scatter plots of prediction comparsion between instruments M5 and MP6 using JSDA, SBC, PDS, CCACT, MSC, TCR
Fig. 5. Scatter plots of prediction comparison between instruments MP5 and MP6 using JSDA, SBC, PDS, CCACT, MSC, TCR
Fig. 6. Scatter plots of prediction comparison between instruments A1 and A2 using JSDA, SBC, PDS, CCACT, MSC, TCR
Fig. 7. Scatter plots of prediction comparison between instruments A1 and A3 using JSDA, SBC, PDS, CCACT, MSC, TCR
Fig. 8. Scatter plots of prediction comparison between instruments A3 and A2 using JSDA, SBC, PDS, CCACT, MSC, TCR
| |||||||||||||||||||||||||||||||||||||||||||||||||||||||||||||||||||||||||||||||||||||||||||
Table 1. RMSEP of corn datasets with SBC, PDS, CCACT, MSC, TCR and JSDA
| |||||||||||||||||||||||||||||||||||||||||||||||||||||||||||||||||||||||||||||||||||||||||||
Table 2. RMSEP of wheat datasets with SBC, PDS, CCACT, MSC, TCR and JSDA

Set citation alerts for the article
Please enter your email address
© Copyright 2018-2021 | Chinese Laser Press. All Rights Reserved 沪ICP备15018463号-20