
Yaping Zhang, Houxin Fan, Ting-Chung Poon, "Optical image processing using acousto-optic modulators as programmable volume holograms: a review [Invited]," Chin. Opt. Lett. 20, 021101 (2022)
- Chinese Optics Letters
- Vol. 20, Issue 2, 021101 (2022)
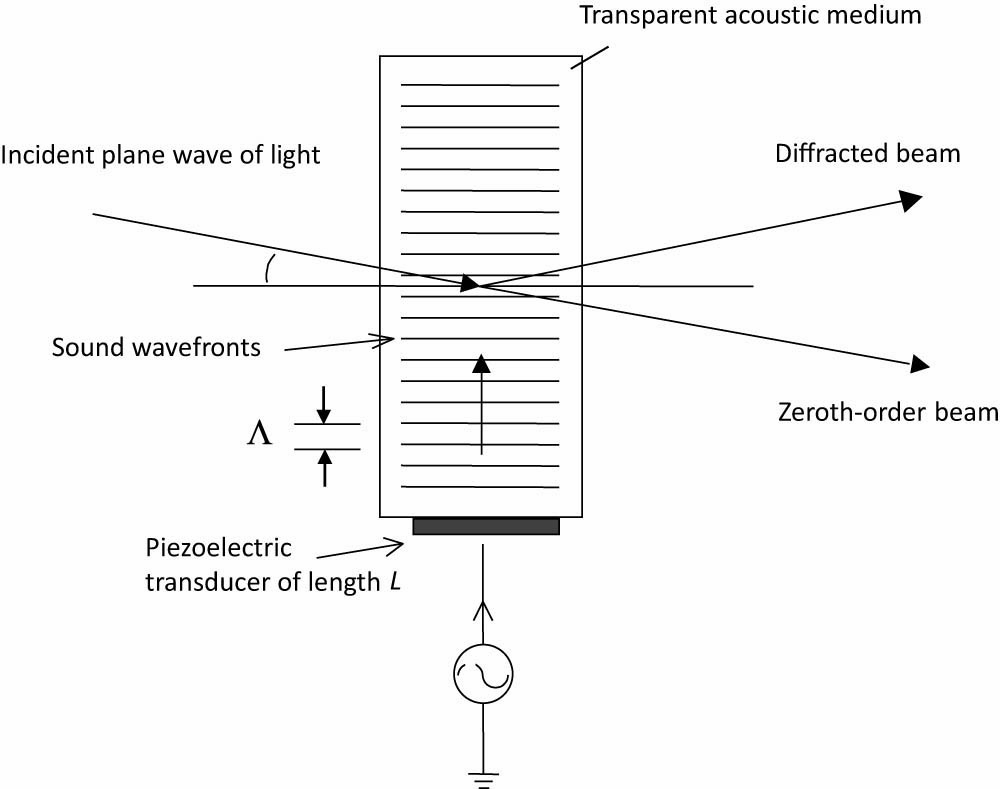
Fig. 1. AOM illustrating diffraction of light by sound.
![Upshifted Bragg diffraction: (a) wavevector diagram and (b) experimental configuration. Adapted from Ref. [28].](/richHtml/col/2022/20/2/021101/img_002.jpg)
Fig. 2. Upshifted Bragg diffraction: (a) wavevector diagram and (b) experimental configuration. Adapted from Ref. [28].
Fig. 3. Downshifted Bragg diffraction: (a) wavevector diagram and (b) experimental configuration. Adapted from Ref. [28].
Fig. 4. Multiple diffraction. Adapted from Ref. [28].
Fig. 5. AOM modeled by a column of sound of width L. Adapted from Ref. [28].
Fig. 6. Diffraction geometry for upshifted Bragg operation. Adapted from Ref. [28].
Fig. 7. Characteristics of |H0(kx′)| and |H1(kx′′)| as a function of Q and α. (a) and (b) Transfer function for the zeroth-order beam and the first-order beam at Λ = 0.01 mm with Q = 14, respectively; (c) and (d) transfer function for the zeroth-order beam and the first-order beam at Λ = 0.01 mm with Q = 28, respectively.
Fig. 8. Flaptop beams obtained by the fine tuning of Q or α (alpha) through H1(kx′′Λ/π). Input laser beam is of the profile e−x2/2σ2. Reprinted with permission from Ref. [16] © The Optical Society.
Fig. 9. Diffraction by AOM and image formation by lens.
Fig. 10. Experimental results on the output plane: (a) image of the object on the output plane when the AOM is turned off; (b) images of the zeroth-order (left) and the first-order (right) beams. Reprinted from Ref. [8]. Note that the figures presented here are the actual images from the original printed article. The PDF version of the figures provided by the publisher has been smeared.
Fig. 11. (a) Input square object, (b) magnitude spectrum of (a), and (c) intensity of the zeroth-order light.
Fig. 12. (a) Cascaded AOM system and (b) intensity of the zeroth-order light |ψ0(2)(x′, y′)|2 at the exit of the cascade AOM system illustrating second-order differentiation operation.
Fig. 13. Intensity of the zeroth-order light |ψ0(2)(x′, y′)|2 at the exit of the cascade AOM system.
Fig. 14. Dual AOMs in a Mach–Zehnder interferometer.
Fig. 15. (a) Input, (b) image processing by a single AOM, and (c) image processing by dual AOMs in a Mach–Zehnder interferometer realizing the computing operation given by Eq. (28 ).
Fig. 16. (a) Image of a 1D chirp grating and (b) line trace across the red line in (a).
Fig. 17. (a) Spectrum of the chirp grating and shifted zeroth-order transfer function for Δδ = 0.15, (b) processed chirp grating, and (c) line trace across (b).
Fig. 18. Processed images for (a), (b) Δδ = 0.2 and (c), (d) Δδ = 0.25.


Set citation alerts for the article
Please enter your email address

© Copyright 2018-2021 | Chinese Laser Press. All Rights Reserved 沪ICP备15018463号-20