• Photonics Research
  • Vol. 5, Issue 4, 362 (2017)
Fuchuan Lei, Rafino M. J. Murphy, Jonathan M. Ward, Yong Yang, and Síle Nic Chormaic*
Author Affiliations
  • Light-Matter Interactions Unit, Okinawa Institute of Science and Technology Graduate University, Onna, Okinawa 904-0495, Japan
  • show less
    DOI: 10.1364/PRJ.5.000362 Cite this Article Set citation alerts
    Fuchuan Lei, Rafino M. J. Murphy, Jonathan M. Ward, Yong Yang, Síle Nic Chormaic. Bandpass transmission spectra of a whispering-gallery microcavity coupled to an ultrathin fiber[J]. Photonics Research, 2017, 5(4): 362 Copy Citation Text show less
    Schematic of the experimental setup. A tapered fiber is side-coupled to a microsphere for transmission spectra measurements. Aside from direct monitoring of the transmitted light by a PD, an MMF is mounted at different positions (a), (b), (c) to collect the scattered light from the tapered fiber-microsphere coupled system. The blue solid line and the red dashed line represent the resonant light and off-resonant light, respectively.
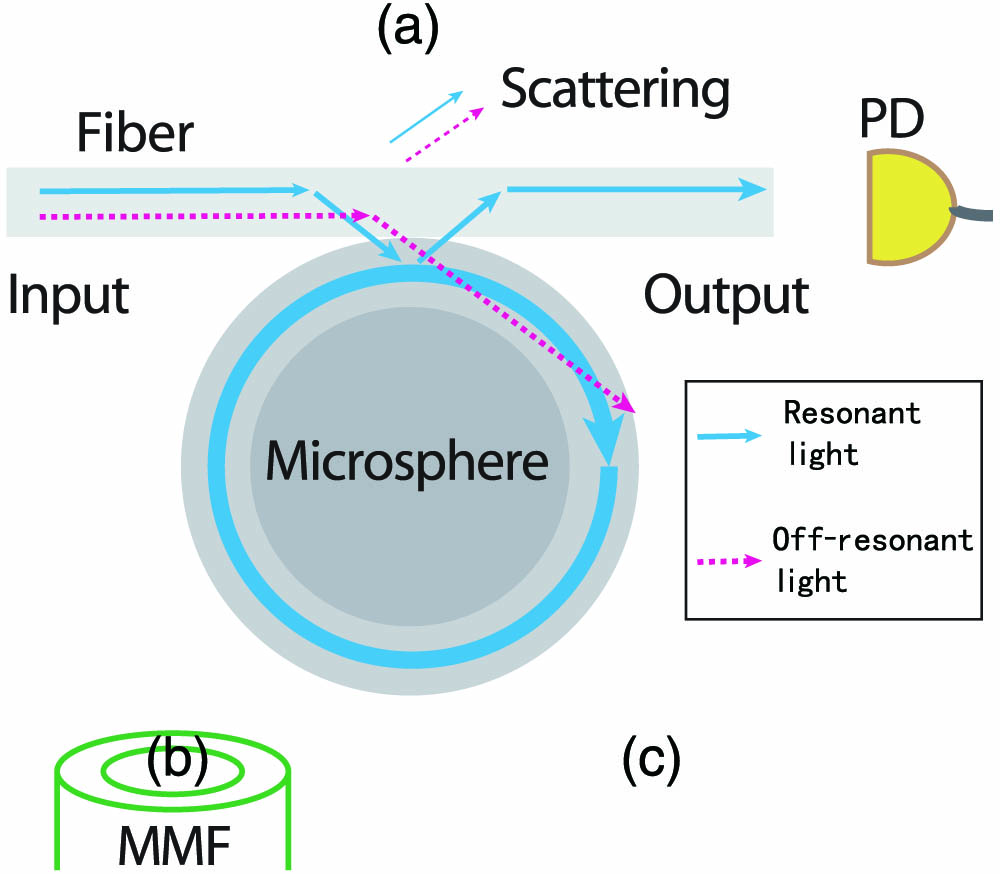
    Fig. 1. Schematic of the experimental setup. A tapered fiber is side-coupled to a microsphere for transmission spectra measurements. Aside from direct monitoring of the transmitted light by a PD, an MMF is mounted at different positions (a), (b), (c) to collect the scattered light from the tapered fiber-microsphere coupled system. The blue solid line and the red dashed line represent the resonant light and off-resonant light, respectively.
    (a) Normalized transmission spectra and (b) the corresponding transmittance of off-resonant light, for varying taper-microsphere gaps. From A to H, the gap decreases from 2.4 μm to 0. For both (a) and (b), the y axis corresponds to transmittance, which has been normalized with respect to the maximum value observed in the transmission spectrum A.
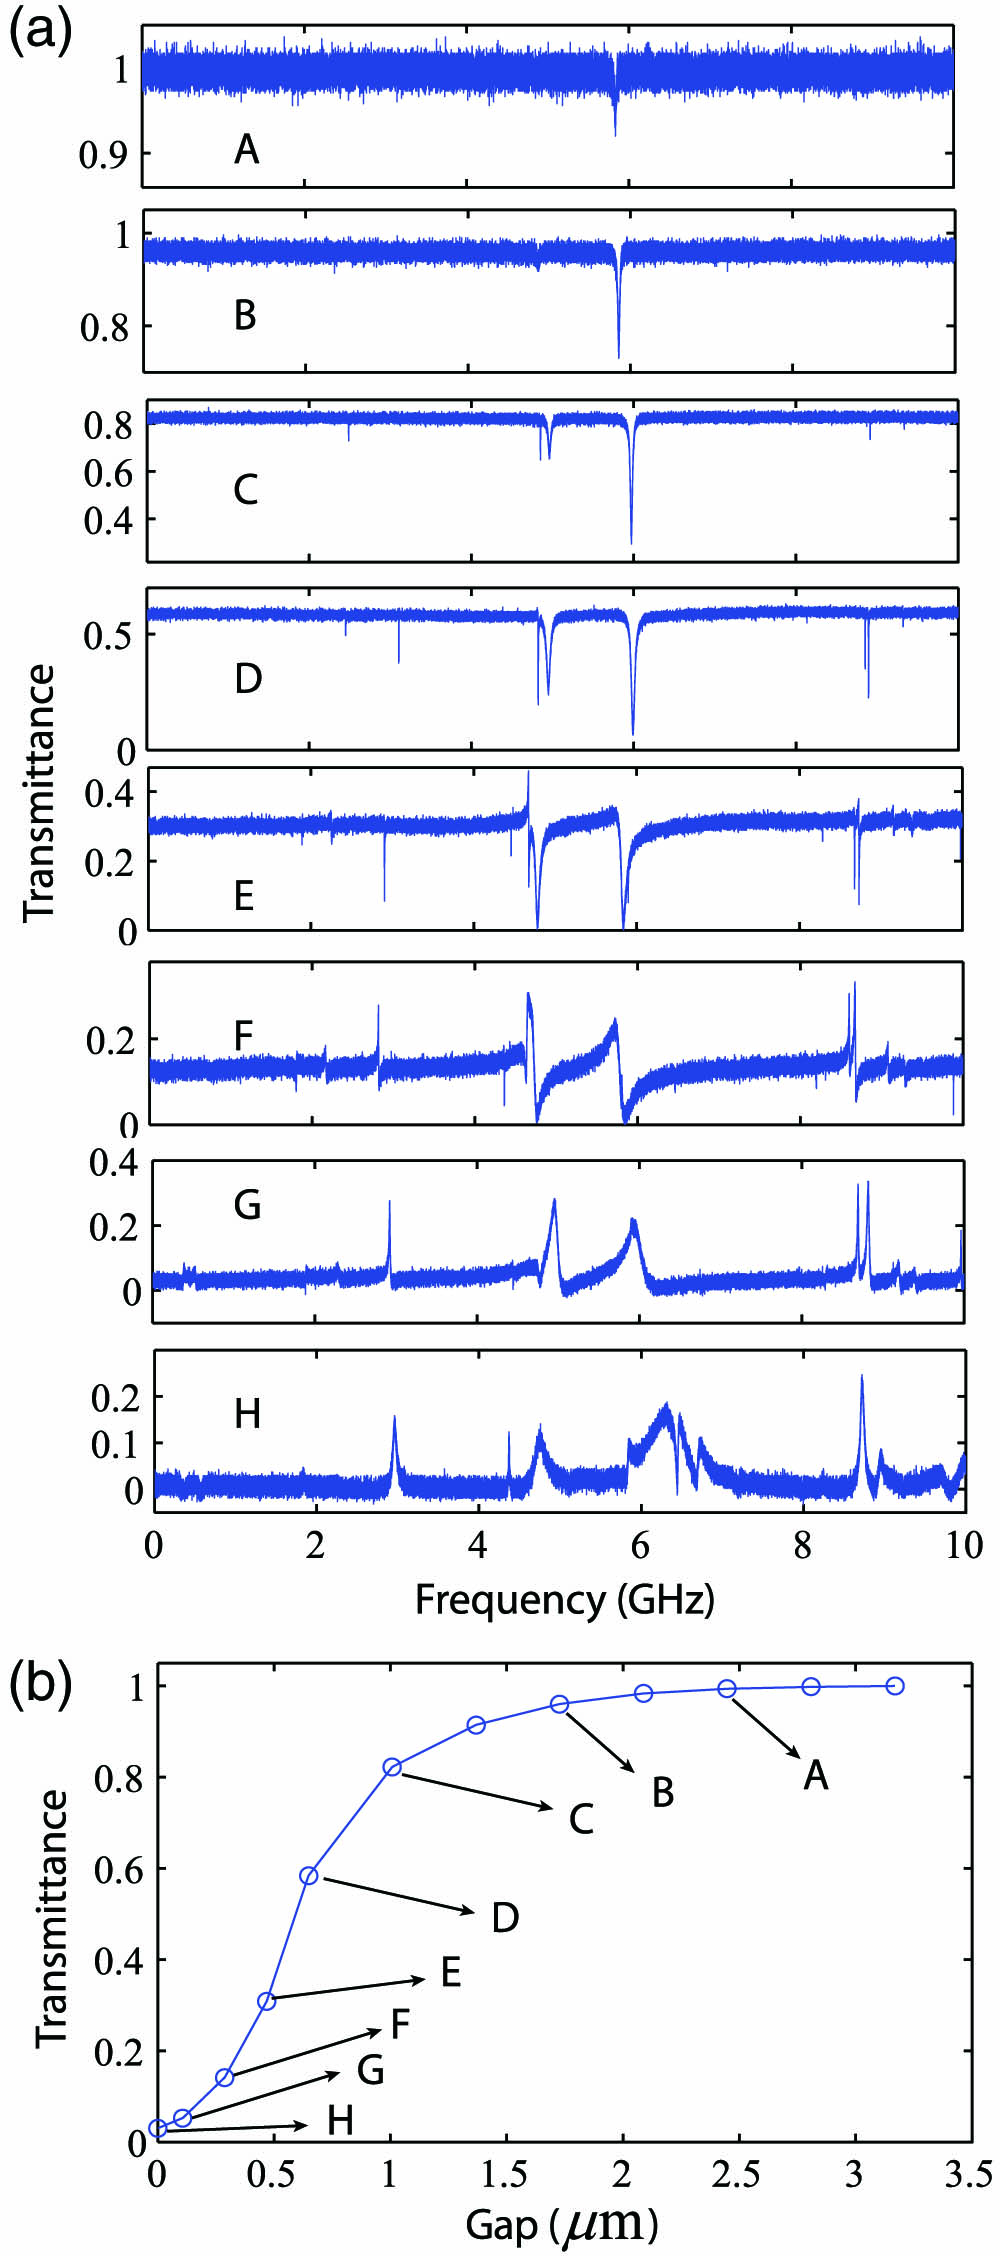
    Fig. 2. (a) Normalized transmission spectra and (b) the corresponding transmittance of off-resonant light, for varying taper-microsphere gaps. From A to H, the gap decreases from 2.4 μm to 0. For both (a) and (b), the y axis corresponds to transmittance, which has been normalized with respect to the maximum value observed in the transmission spectrum A.
    (a) Transmission spectra and (b) the corresponding transmittance of off-resonant light with varying input polarization direction. From A to E, the polarization direction changes by 90°. The polarization was incremented in steps of 10° for a net change of 400°. (c) The simulated electric field distribution of the linearly polarized, HE11 mode for a fiber with a diameter of 600 nm. The arrows indicate the direction of the electric field along the cross-section.
    Fig. 3. (a) Transmission spectra and (b) the corresponding transmittance of off-resonant light with varying input polarization direction. From A to E, the polarization direction changes by 90°. The polarization was incremented in steps of 10° for a net change of 400°. (c) The simulated electric field distribution of the linearly polarized, HE11 mode for a fiber with a diameter of 600 nm. The arrows indicate the direction of the electric field along the cross-section.
    Transmission spectra for contact coupling with different fiber diameters. From bottom to top, the tapered fiber was translated to increase its diameter at the coupling point. According to the displacement, the diameter was estimated to be 600 nm, 800 nm, 1.2 μm, 1.7 μm, and 3 μm, respectively.
    Fig. 4. Transmission spectra for contact coupling with different fiber diameters. From bottom to top, the tapered fiber was translated to increase its diameter at the coupling point. According to the displacement, the diameter was estimated to be 600 nm, 800 nm, 1.2 μm, 1.7 μm, and 3 μm, respectively.
    FEM simulation results. (a) Transmission spectrum: The distribution of the electrical field for (b) resonant case and (c) off-resonant case.
    Fig. 5. FEM simulation results. (a) Transmission spectrum: The distribution of the electrical field for (b) resonant case and (c) off-resonant case.
    Spectra of the transmission through the ultrathin fiber (red, bottom) and the scattering spectra from the multimode fiber (blue, top). For ease of comparison, the spectra are not normalized but shifted relative to each other. (a), (b), and (c) correspond to the multimode fiber being placed at positions (a), (b), and (c) in Fig. 1.
    Fig. 6. Spectra of the transmission through the ultrathin fiber (red, bottom) and the scattering spectra from the multimode fiber (blue, top). For ease of comparison, the spectra are not normalized but shifted relative to each other. (a), (b), and (c) correspond to the multimode fiber being placed at positions (a), (b), and (c) in Fig. 1.
    Fuchuan Lei, Rafino M. J. Murphy, Jonathan M. Ward, Yong Yang, Síle Nic Chormaic. Bandpass transmission spectra of a whispering-gallery microcavity coupled to an ultrathin fiber[J]. Photonics Research, 2017, 5(4): 362
    Download Citation