• Laser & Optoelectronics Progress
  • Vol. 58, Issue 21, 2114007 (2021)
Yuling Gong1、2, Chen Cui2, and Meiping Wu2、*
Author Affiliations
  • 1School of Shipping and Mechatronic Engineering, Taizhou University, Taizhou , Jiangsu 225300, China
  • 2School of Mechanical Engineering, Jiangnan University, Wuxi , Jiangsu 214122, China
  • show less
    DOI: 10.3788/LOP202158.2114007 Cite this Article Set citation alerts
    Yuling Gong, Chen Cui, Meiping Wu. Effect of Nano-CeO2 Content on Microstructure and Corrosion Resistance of Ni60A Coating[J]. Laser & Optoelectronics Progress, 2021, 58(21): 2114007 Copy Citation Text show less
    SEM micrographs of powder. (a) Ni60A powder; (b) CeO2 powder
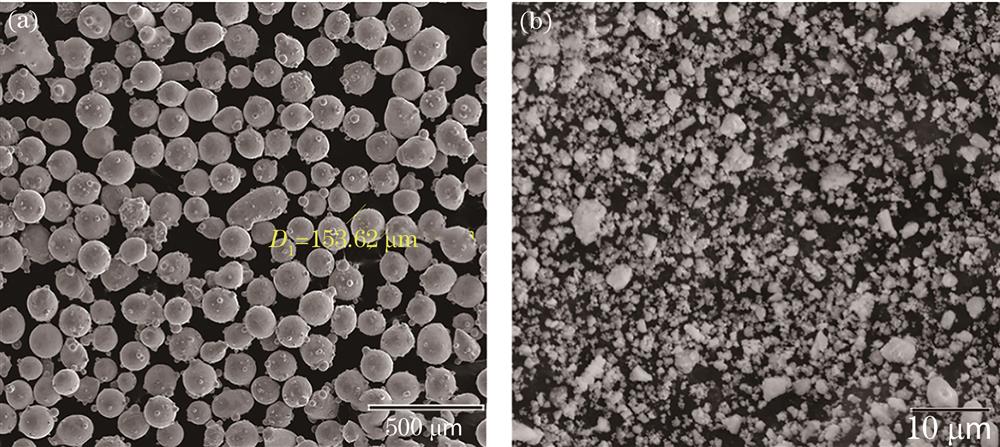
    Fig. 1. SEM micrographs of powder. (a) Ni60A powder; (b) CeO2 powder
    Picture and principle diagram of laser cladding equipment. (a) Equipment picture; (b) principle diagram
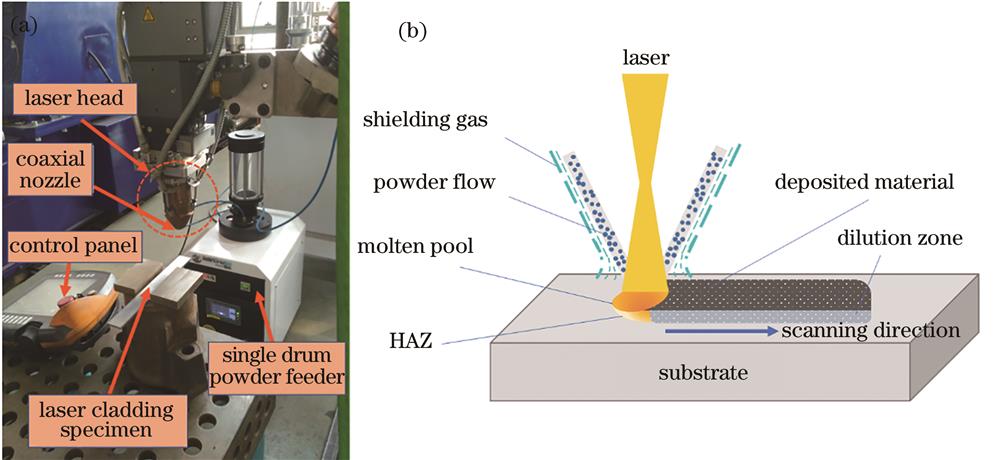
    Fig. 2. Picture and principle diagram of laser cladding equipment. (a) Equipment picture; (b) principle diagram
    XRD diffraction patterns of Ni60A coating with different CeO2 mass fractions of 0-4%
    Fig. 3. XRD diffraction patterns of Ni60A coating with different CeO2 mass fractions of 0-4%
    Microstructures of the coating in the top, middle, and bottom regions with different CeO2 mass fractions
    Fig. 4. Microstructures of the coating in the top, middle, and bottom regions with different CeO2 mass fractions
    Enlarged diagrams of CeO2/Ni60A coating with different CeO2 mass fractions in the calibration areas of Fig. 4. (a) Ni60A; (b) 1% CeO2/Ni60A; (c) 2% CeO2/Ni60A; (d) 3% CeO2/Ni60A
    Fig. 5. Enlarged diagrams of CeO2/Ni60A coating with different CeO2 mass fractions in the calibration areas of Fig. 4. (a) Ni60A; (b) 1% CeO2/Ni60A; (c) 2% CeO2/Ni60A; (d) 3% CeO2/Ni60A
    EDS spectra of typical tissues in Fig. 5. (a) Region A; (b) region B; (c) region C; (d) region D
    Fig. 6. EDS spectra of typical tissues in Fig. 5. (a) Region A; (b) region B; (c) region C; (d) region D
    Dynamic polarization curves of Ni60A coating with different CeO2 mass fractions
    Fig. 7. Dynamic polarization curves of Ni60A coating with different CeO2 mass fractions
    Nyquist curves and equivalent circuit diagram of different CeO2/Ni60A coatings. (a) Nyquist curve; (b) equivalent circuit diagram
    Fig. 8. Nyquist curves and equivalent circuit diagram of different CeO2/Ni60A coatings. (a) Nyquist curve; (b) equivalent circuit diagram
    Morphologies of different CeO2/Ni60A coatings after electrochemical corrosion. (a) Ni60A; (b) 1% CeO2 /Ni60A;(c) 2% CeO2/Ni60A; (d) 3% CeO2/Ni60A; (e) 4% CeO2/Ni60A
    Fig. 9. Morphologies of different CeO2/Ni60A coatings after electrochemical corrosion. (a) Ni60A; (b) 1% CeO2 /Ni60A;(c) 2% CeO2/Ni60A; (d) 3% CeO2/Ni60A; (e) 4% CeO2/Ni60A
    MaterialMass fraction /%
    TiAlVCFeNBSiCrNi
    Ti6Al4VBal.6.034.010.100.300.01----
    Ni60A---0.908.00-3.304.5016.00Bal.
    Table 1. Chemical composition of powder
    SampleEcorr /VIcorr /(10-7 A·cm-2Rp /(Ω·cm-2
    Ni60A-0.5804.90990612.6
    1% CeO2/Ni60A-0.6923.741106568.5
    2% CeO2/Ni60A-0.7932.584146404.7
    3% CeO2/Ni60A-0.6882.110190674.0
    4% CeO2/Ni60A-0.6662.152178061.4
    Table 2. Electrochemical parameters of Ni60A coating with different CeO2 mass fractions
    SampleRs /(Ω·cm-2Qc /(10-5 s-n·cm-2n1Rc /(Ω·cm-2Qf /(10-6 s-n·cm-2n2Rt /(104 Ω·cm-2
    Ni60A16.103.2400.732216.350.37120.8.9901.528
    1% CeO2/Ni60A15.882.4710.746512.480.76490.8.6192.239
    2% CeO2/Ni60A87.993.2420.696012.081.6521.398×10-46.070
    3% CeO2/Ni60A52.062.2470.833314.612.7480.8.22035.17
    4% CeO2/Ni60A54.000.66710.765825.971.4570.8.1738.757
    Table 3. Equivalent circuit parameters of different CeO2 /Ni60A coatings
    Yuling Gong, Chen Cui, Meiping Wu. Effect of Nano-CeO2 Content on Microstructure and Corrosion Resistance of Ni60A Coating[J]. Laser & Optoelectronics Progress, 2021, 58(21): 2114007
    Download Citation