• Infrared and Laser Engineering
  • Vol. 51, Issue 5, 20211125 (2022)
Miao Yu1, Mingyang Sun2, Yutong He1, Chongfu Zhang1, Zhifeng Zheng3, and Qian Kong1
Author Affiliations
  • 1School of Electronic Information Engineering, University of Electronic Science and Technology of China, Zhongshan Institute, Zhongshan 528402, China
  • 2College of Instrumentation & Electrical Engineering, Jilin University, Changchun 130012, China
  • 3Zhuhai Pegasus Optoelectronics Technology Co., Ltd., Zhuhai 519000, China
  • show less
    DOI: 10.3788/IRLA20211125 Cite this Article
    Miao Yu, Mingyang Sun, Yutong He, Chongfu Zhang, Zhifeng Zheng, Qian Kong. Optimization of low frequency response performance of phase sensitive optical time-domain reflectometry system[J]. Infrared and Laser Engineering, 2022, 51(5): 20211125 Copy Citation Text show less
    Schematic diagram of frequency modulated clock signal waveform inside acousto-optic modulator driver
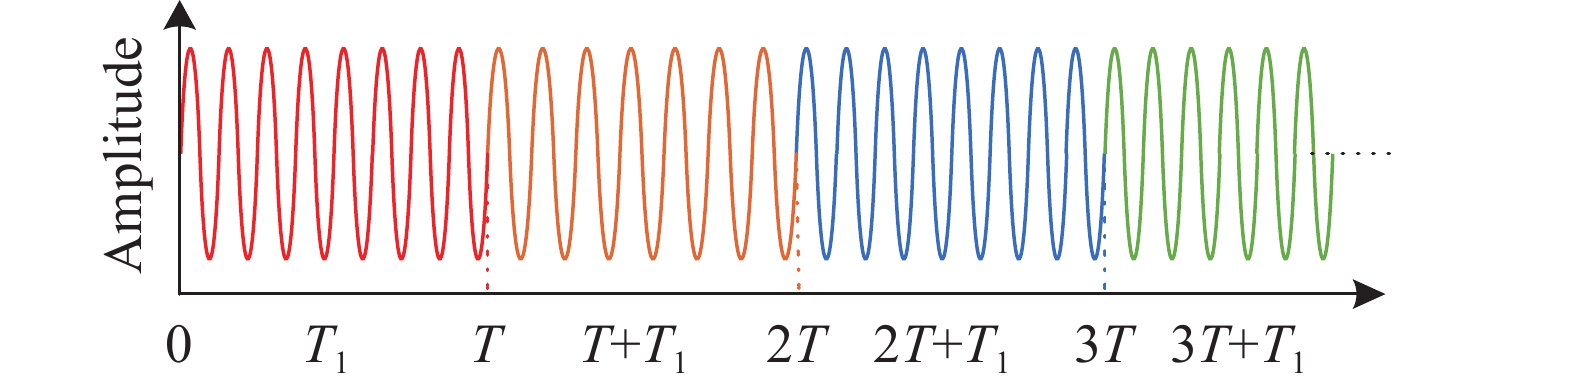
    Fig. 1. Schematic diagram of frequency modulated clock signal waveform inside acousto-optic modulator driver
    Schematic diagram of pulse chopper signal waveform input to acousto-optic modulator driver
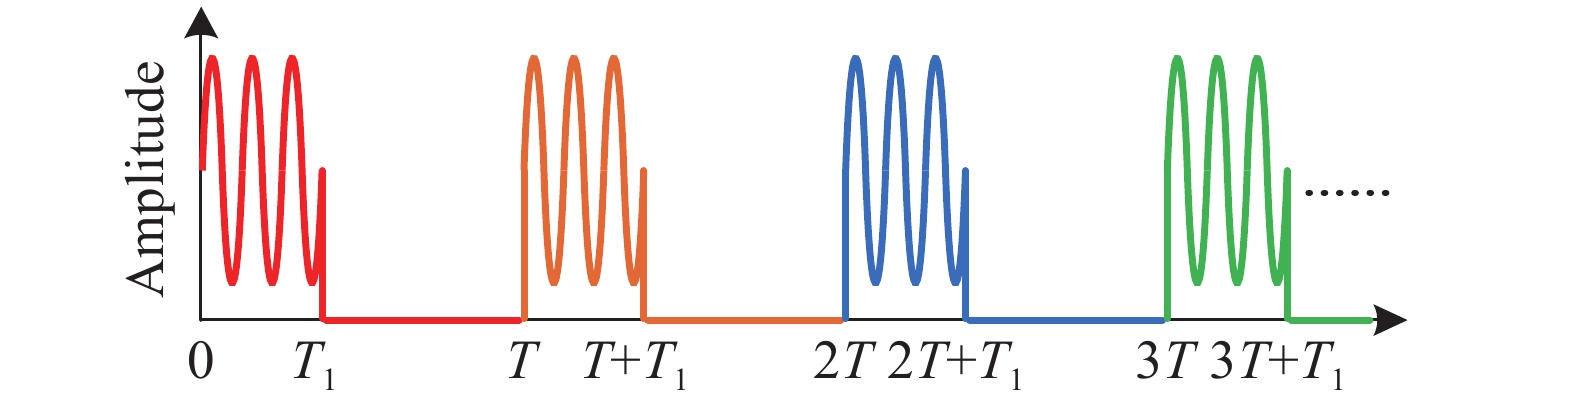
    Fig. 2. Schematic diagram of pulse chopper signal waveform input to acousto-optic modulator driver
    Schematic diagram of pulse modulated signal waveform output by acoustooptic modulator driver
    Fig. 3. Schematic diagram of pulse modulated signal waveform output by acoustooptic modulator driver
    Pulse-modulated signal curves output from a conventional acousto-optic modulated driver
    Fig. 4. Pulse-modulated signal curves output from a conventional acousto-optic modulated driver
    Clock homologous (red) and clock nonhomologous (blue) ϕ-OTDR coherent detection system structure
    Fig. 5. Clock homologous (red) and clock nonhomologous (blue) ϕ-OTDR coherent detection system structure
    Pulse modulation signal curves of the acoust-optic modulation driver after clock homology control
    Fig. 6. Pulse modulation signal curves of the acoust-optic modulation driver after clock homology control
    0.1 Hz disturbance signal. (a) Position-time-intensity response diagram of clock homologous system; (b) Position-time-intensity response diagram of clock non-homologous system; (c) Phase demodulation curve of both; (d) Spectrum diagram of both
    Fig. 7. 0.1 Hz disturbance signal. (a) Position-time-intensity response diagram of clock homologous system; (b) Position-time-intensity response diagram of clock non-homologous system; (c) Phase demodulation curve of both; (d) Spectrum diagram of both
    [in Chinese]
    Fig. 8. [in Chinese]
    10 Hz disturbance signal. (a) Position-time-intensity response diagram of clock homologous system; (b) Position-time-intensity response diagram of clock non-homologous system; (c) Phase demodulation curve of both; (d) Spectrum diagram of both
    Fig. 8. 10 Hz disturbance signal. (a) Position-time-intensity response diagram of clock homologous system; (b) Position-time-intensity response diagram of clock non-homologous system; (c) Phase demodulation curve of both; (d) Spectrum diagram of both
    500 Hz disturbance signal. (a) Position-time-intensity response diagram of clock homologous system; (b) Position-time-intensity response diagram of clock non-homologous system; (c) Phase demodulation curve of both; (d) Spectrum diagram of both
    Fig. 9. 500 Hz disturbance signal. (a) Position-time-intensity response diagram of clock homologous system; (b) Position-time-intensity response diagram of clock non-homologous system; (c) Phase demodulation curve of both; (d) Spectrum diagram of both
    1 kHz disturbance signal. (a) Position-time-intensity response diagram of clock homologous system; (b) Position-time-intensity response diagram of clock non-homologous system; (c) Phase demodulation curve of both; (d) Spectrum diagram of both
    Fig. 10. 1 kHz disturbance signal. (a) Position-time-intensity response diagram of clock homologous system; (b) Position-time-intensity response diagram of clock non-homologous system; (c) Phase demodulation curve of both; (d) Spectrum diagram of both
    Miao Yu, Mingyang Sun, Yutong He, Chongfu Zhang, Zhifeng Zheng, Qian Kong. Optimization of low frequency response performance of phase sensitive optical time-domain reflectometry system[J]. Infrared and Laser Engineering, 2022, 51(5): 20211125
    Download Citation