
Philip Dalladay-Simpson, Bartomeu Monserrat, Li Zhang, Federico Gorelli. Distinct vibrational signatures and complex phase behavior in metallic oxygen[J]. Matter and Radiation at Extremes, 2024, 9(2): 028401
- Matter and Radiation at Extremes
- Vol. 9, Issue 2, 028401 (2024)
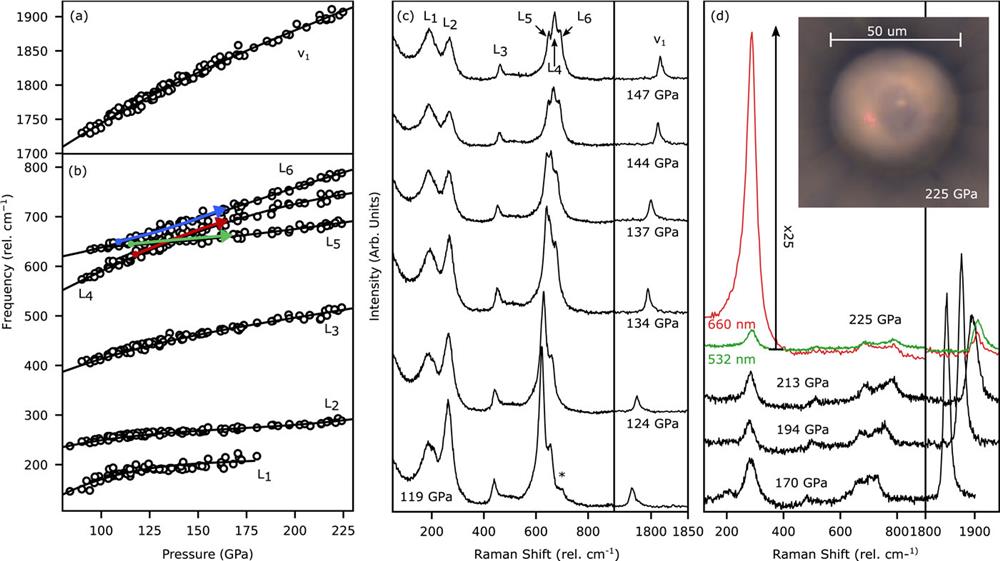
Fig. 1. Raman spectra of ζ -O2 to 225 GPa. (a) Vibrational frequency ν 1 of ζ -O2. (b) Low-frequency lattice modes of ζ -O2, denoted L1 to L6 in order of increasing frequency. Owing to the proximity of excitations at 130 GPa, red, green, and blue arrows are used to provide a guide to the pressure evolution of modes L4, L5, and L6, respectively. In both (a) and (b), frequencies have been extracted and compiled from compression and decompression experiments on bulk O2 and O2–He mixtures, as well as on O2–He mixtures that have undergone laser heating. The solid black lines are third-order polynomial fits to the pressure evolution of the excitation and are used for comparison with candidate structures in Fig. 2 . (c) Representative Raman spectra upon decompression of oxygen that was laser-heated at 150 GPa in a helium pressure-transmitting medium. The * highlights the strongest excitation characteristic of ϵ ′-O2 at 119 GPa, marking the onset of phase coexistence. (d) Representative Raman spectra from the compression of bulk O2 (see the panel inset), up to 225 GPa. To demonstrate the observed strong Raman resonance of the L2 mode at high pressures, spectra from excitation wavelengths of 532 and 660 nm are shown. The 25× intensity enhancement of L2 has been calculated based on a normalization procedure from the Raman intensity of the unstressed diamond edge.
![ζ-O2 structural and vibrational compatibility with candidate structures. (a)–(c) Experimentally measured and fitted pressure evolution of excitations (L1, …, L6 and ν1) up to 225 GPa [Fig. 1(b)] plotted with the simulated Raman frequencies from the candidate structures: (a) C2/m; (b) C2/c; (c) Ci. (d) Integrated x-ray diffraction pattern of a laser-heated O2–He mixture at 140 GPa. The red blue, and green ticks indicate calculated reflections from the C2/m, C2/c, and Ci candidates structures, respectively, optimized at 140 GPa (structural details are provided in Table S1 in the supplementary material). The purple and gray index ticks indicated Bragg reflections from helium (140 GPa21) and rhenium (145 GPa22), respectively.](/richHtml/MRE/2024/9/2/028401/img_2.jpg)
Fig. 2. ζ -O2 structural and vibrational compatibility with candidate structures. (a)–(c) Experimentally measured and fitted pressure evolution of excitations (L1, …, L6 and ν 1) up to 225 GPa [Fig. 1(b) ] plotted with the simulated Raman frequencies from the candidate structures: (a) C 2/m ; (b) C 2/c ; (c) Ci . (d) Integrated x-ray diffraction pattern of a laser-heated O2–He mixture at 140 GPa. The red blue, and green ticks indicate calculated reflections from the C 2/m , C 2/c , and Ci candidates structures, respectively, optimized at 140 GPa (structural details are provided in Table S1 in the supplementary material ). The purple and gray index ticks indicated Bragg reflections from helium (140 GPa21 ) and rhenium (145 GPa22 ), respectively.
Fig. 3. Raman map of an originally ϵ -O2 single crystal. (a) Micrograph, taken in reflective and transmitted light at a pressure of 130 GPa, of a sample of a large oxygen crystal that was grown at 20 GPa and 150 °C in a helium pressure-transmitting medium. The right panel is a magnified view of the originally ϵ -O2 single crystal, with colored markers corresponding to the Raman spectra in (b) and with the points representing a line scan with 3 μ m spacing. (b) Color-coded Raman spectrum corresponding to the Raman mapping in (a). The black and red ticks at the bottom denote excitations representative of ζ -O2 and ϵ -O2, respectively.
Fig. 4. Effects of laser heating on coexistence of ζ -O2 and ϵ ′-O2 at 130 GPa. (a) Representative Raman spectra of O2 before (blue curve) and after (black curve) laser heating. The blue curve is representative of an O2 sample exhibiting coexistence of both ζ -O2 and ϵ ′-O2, and the tick marks identify the characteristic excitations. The black curve is representative of pure ζ -O2, with no excitations characteristic of ϵ ′-O2 being observable. (b) and (c) Micrographs of O2 crystallites in helium respectively before and after laser heating. The images were taken in both reflected and transmitted light.
Fig. 5. Hysteresis and coexistence of ζ -O2 and ϵ ′-O2 on compression and decompression. (a) Top: one-dimensional phase diagrams of oxygen along the room-temperature isotherm on compression and decompression up to 225 GPa. The dashed line indicates the established metallization pressure of bulk oxygen.1,5 Bottom: proposed evolution of candidate models, evidence for which is provided in Secs. II A and II B , with their respective numbers of O2 molecules in the primitive unit cell for metallic oxygen beyond the precursory ϵ -O2 phase. (b) Representative Raman spectra of the coexistent metallic phases of oxygen, ϵ ′-O2 and ζ -O2, on decompression after laser heating in helium at 130 GPa. The black, blue, and red curves are Raman spectra from ζ -O2, ϵ ′-O2 + ζ -O2 and ϵ ′-O2, respectively. Black and red ticks correspond to the excitations from ζ -O2 and ϵ ′-O2, respectively.

Set citation alerts for the article
Please enter your email address
© Copyright 2018-2021 | Chinese Laser Press. All Rights Reserved 沪ICP备15018463号-20