• Matter and Radiation at Extremes
  • Vol. 9, Issue 2, 028401 (2024)
Philip Dalladay-Simpson1、*, Bartomeu Monserrat2、3, Li Zhang1, and Federico Gorelli1、4、5
Author Affiliations
  • 1Center for High Pressure Science Technology Advanced Research, 1690 Cailun Road, Shanghai 201203, China
  • 2Department of Materials Science and Metallurgy, University of Cambridge, 27 Charles Babbage Road, Cambridge CB3 0FS, United Kingdom
  • 3Cavendish Laboratory, University of Cambridge, J. J. Thomson Avenue, Cambridge CB3 0HE, United Kingdom
  • 4Istituto Nazionale di Ottica, Consiglio Nazionale delle Ricerche (CNR-INO), 50125 Florence, Italy
  • 5Shanghai Advanced Research in Physical Sciences (SHARPS), Shanghai, China
  • show less
    DOI: 10.1063/5.0160060 Cite this Article
    Philip Dalladay-Simpson, Bartomeu Monserrat, Li Zhang, Federico Gorelli. Distinct vibrational signatures and complex phase behavior in metallic oxygen[J]. Matter and Radiation at Extremes, 2024, 9(2): 028401 Copy Citation Text show less

    Abstract

    Evidence for metallization in dense oxygen has been reported for over 30 years [Desgreniers et al., J. Phys. Chem. 94, 1117 (1990)] at a now routinely accessible 95 GPa [Shimizu et al., Nature 393, 767 (1998)]. However, despite the longevity of this result and the technological advances since, the nature of the metallic phase remains poorly constrained [Akahama et al., Phys. Rev. Lett. 74, 4690 (1995); Goncharov et al., Phys. Rev. B 68, 224108 (2003); Ma, Phys. Rev. B 76, 064101 (2007); and Weck et al., Phys. Rev. Lett. 102, 255503 (2009)]. In this work, through Raman spectroscopy, we report the distinct vibrational characteristics of metallic ζ-O2 from 85 to 225 GPa. In comparison with numerical simulations, we find reasonable agreement with the C2/m candidate structure up to about 150 GPa. At higher pressures, the C2/m structure is found to be unstable and incompatible with experimental observations. Alternative candidate structures, C2/c and Ci, with only two molecules in the primitive unit cell, are found to be stable and more compatible with measurements above 175 GPa, indicative of the dissociation of (O2)4 units. Further, we report and discuss a strong hysteresis and metastability with the precursory phase ϵ-O2. These findings will reinvigorate experimental and theoretical work into the dense oxygen system, which will have importance for oxygen-bearing chemistry, prevalent in the deep Earth, as well as fundamental physics.

    I. INTRODUCTION

    Pressure is a fundamental thermodynamic tool to probe and tune novel interactions within materials by driving a reduction in atomic and molecular volumes. This is perhaps most clearly demonstrated in molecular systems, where decreasing the distance between molecular units can enhance intermolecular interactions and, under sufficient compression, can render familiar ambient dielectric gases into metals1–3 and/or close packed atomic solids.4 A prominent example is metallic-atomic solid hydrogen, originally proposed by Wigner and Huntington in 1935,2 which is expected to exist at densities just beyond those achievable with current experimental techniques and has come to be known as a “holy grail” of condensed matter sciences. By contrast, oxygen, a fundamental molecule with high terrestrial abundance, metallizes at relatively routine pressures (about one million atmospheres) and has become the prototypical example of density-driven molecular metallization. Over 30 years ago, Desgreniers et al.1 reported the first evidence for the metallization of oxygen, observing a significant enhancement of reflectivity in the visible and near-infrared. They also noted at their highest pressures, about 130 GPa, that oxygen becomes visually indistinguishable from the surrounding metallic gasket material. This metallic behavior in oxygen was subsequently confirmed by resistivity measurements5 and, shortly afterward, superconductivity was observed at about 100 GPa and 0.5 K.5 More recently, the metallic character of oxygen has been confirmed by x-ray Raman scattering measurements at a comparable 94 GPa.6 The metallization of oxygen was reported to be accompanied by an isostructural transition with abrupt changes in x-ray diffraction,7 which is at odds with metallization in other diatomic molecular systems, such as the halogens and hydrogen halides, which typically undergo a second-order metallization with no structural modification, as is also expected to be the case for hydrogen.4,8–10

    From a historical standpoint, a period of three decades elapsed from the discovery in 1979 of the lower-pressure ϵ-O2 phase to its full structural refinement, with the reported observation of O8 clusters in the form of (O2)4 units.11,12 As far as structural characterization of the metallic ζ-O2 phase is concerned, this timespan has now been surpassed, and therefore fundamental physical insight into the nature of metallic oxygen has remained elusive. Currently, our best understanding of this phase comes from the interplay of numerical simulations, specifically ab initio evolutionary crystal structure predictions,13 and experimental observations.7,14–16 Simulations have yielded two energetically competitive monoclinic structures with similar enthalpies and with space groups C2/c and C2/m with four and eight molecules per unit cell, respectively.13 Of these two, the C2/m structure, which is isostructural to the ϵ-O2 phase, was identified as the most promising candidate structure, since it better reproduced the experimentally observed powder x-ray diffraction (XRD) measurements7 and Raman frequencies.15 This C2/m structure retains the (O2)4 molecular units of the precursory ϵ-O2 phase, and therefore no significant molecular rearrangement is expected for the ϵζ phase transition. Further support for this choice of space group came from subsequent single-crystal diffraction results for ζ-O2 at 133 GPa;14 although the authors of Ref. 14 could index both a C2/c and an a C2/m unit cell, the latter was chosen on the basis of a complex analysis of crystal twinning and the number of modes present in the recorded Raman spectrum.

    Raman spectroscopy has long been a pioneering tool for mapping out vast swathes of phase space for materials, particularly for molecular systems. This is well exemplified by the complex low-pressure phase diagram of oxygen, where the molecule’s magnetic moment plays a significant role. At higher pressures, the precise nature of the phase diagram around the metallization of oxygen remains poorly constrained, in part because of the exceptionally challenging nature of measuring the Raman effect in metals,17 which is nontrivial even under ambient conditions.18 This difficulty is due to the presence of free charge carriers, which can effectively screen incident electromagnetic radiation, as a consequence of which depths of only tens of nanometers can be probed with conventional Raman spectroscopy. Owing to these challenges, Raman studies of metals at high pressures have remained limited compared with other classes of materials, with only a few experiments reported on the metallic oxygen system to date.14,15,19

    In the study described in the present paper, oxygen was loaded into a diamond anvil cell and compressed to pressures in excess of two million atmospheres in order to characterize the Raman signature of ζ-O2 as well as the phase diagram of O2 at extreme densities. To rule out the possibility of interference by chemical reactions, various methods for loading oxygen samples were adopted, such as (1) O2 in helium, (2) O2 in helium with laser heating, and (3) compression of bulk O2 (more details of experimental loading procedures can be found in the supplementary material). In addition to Raman spectroscopy, complementary x-ray diffraction experiments and numerical simulations were carried out at 140 GPa and up to 240 GPa, respectively. It was found that the Raman spectrum of ζ-O2 is simple compared with that of ϵ-O2, with only seven observable Raman excitations, consisting of six lattice modes (L1, …, L6) and one vibrational mode (ν1). Although the previously proposed model13,14 for ζ-O2, C2/m, exhibits reasonable agreement with experimental observation up to 150 GPa, significant discrepancies and structural instabilities are found at higher pressures. Above 175 GPa, the loss of a low-frequency lattice mode is observed, and structural models with two molecules in the primitive unit cell are found to be stable and compatible with experimentally observed frequencies. This is indicative of the loss of (O2)4 units, which are characteristic of the lower-pressure phases of oxygen. In addition, a strong hysteresis is observed between ϵ-O2 and ζ-O2, which are found to coexist for 60 and 40 GPa on compression and decompression, respectively, making the equilibrium phase boundary hard to define. The metastability and phase coexistence can be removed through laser heating. This complex behavior is indicative of a first-order phase transition between the ϵ-O2 and ζ-O2 phases, ruling out a displacive or second-order transition as previously suggested.14,16

    II. RESULTS AND DISCUSSION

    A. Raman signature of ζ-O2

    Here, ζ-O2 was observed from 85 GPa up to the highest pressures of 225 GPa, as can be seen in Figs. 1 and 5 and in Fig. S2 (supplementary material), while evidence for a possible modification associated with the loss of a lattice mode (L1) at 175 GPa will be discussed in Sec. II B. In Fig. 1, the evolution and pressure dependence of a distinct ζ-O2 Raman signature have been extracted and compiled from all experiments on compression and decompression. The identification of the various modes of ζ-O2, which characterize the interplay with precursory phases, together with a detailed description of the experimental measurements, can be found in Sec. II C and in Fig. S2 and the associated supplementary material.

    Raman spectra of ζ-O2 to 225 GPa. (a) Vibrational frequency ν1 of ζ-O2. (b) Low-frequency lattice modes of ζ-O2, denoted L1 to L6 in order of increasing frequency. Owing to the proximity of excitations at 130 GPa, red, green, and blue arrows are used to provide a guide to the pressure evolution of modes L4, L5, and L6, respectively. In both (a) and (b), frequencies have been extracted and compiled from compression and decompression experiments on bulk O2 and O2–He mixtures, as well as on O2–He mixtures that have undergone laser heating. The solid black lines are third-order polynomial fits to the pressure evolution of the excitation and are used for comparison with candidate structures in Fig. 2. (c) Representative Raman spectra upon decompression of oxygen that was laser-heated at 150 GPa in a helium pressure-transmitting medium. The * highlights the strongest excitation characteristic of ϵ′-O2 at 119 GPa, marking the onset of phase coexistence. (d) Representative Raman spectra from the compression of bulk O2 (see the panel inset), up to 225 GPa. To demonstrate the observed strong Raman resonance of the L2 mode at high pressures, spectra from excitation wavelengths of 532 and 660 nm are shown. The 25× intensity enhancement of L2 has been calculated based on a normalization procedure from the Raman intensity of the unstressed diamond edge.

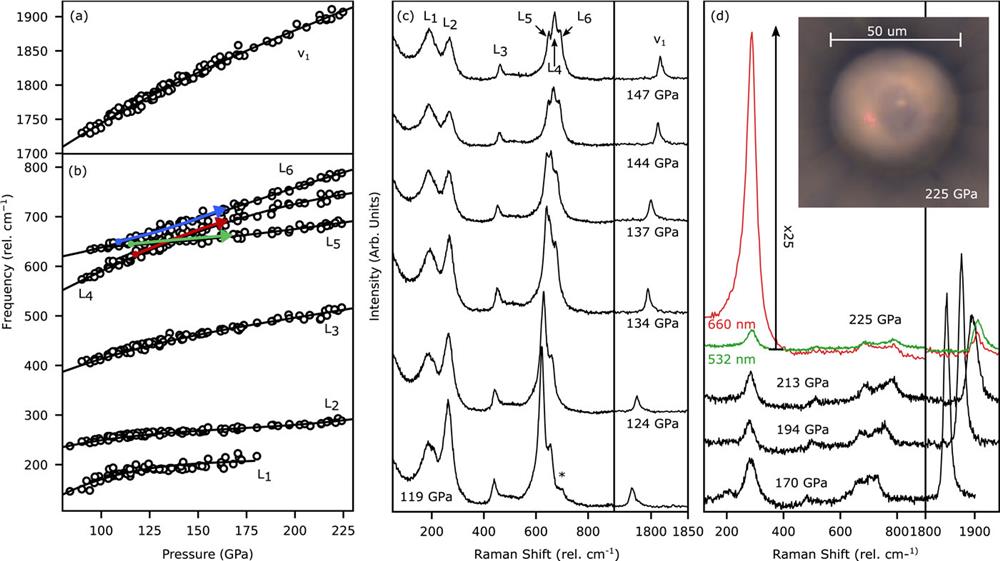
    Figure 1.Raman spectra of ζ-O2 to 225 GPa. (a) Vibrational frequency ν1 of ζ-O2. (b) Low-frequency lattice modes of ζ-O2, denoted L1 to L6 in order of increasing frequency. Owing to the proximity of excitations at 130 GPa, red, green, and blue arrows are used to provide a guide to the pressure evolution of modes L4, L5, and L6, respectively. In both (a) and (b), frequencies have been extracted and compiled from compression and decompression experiments on bulk O2 and O2–He mixtures, as well as on O2–He mixtures that have undergone laser heating. The solid black lines are third-order polynomial fits to the pressure evolution of the excitation and are used for comparison with candidate structures in Fig. 2. (c) Representative Raman spectra upon decompression of oxygen that was laser-heated at 150 GPa in a helium pressure-transmitting medium. The * highlights the strongest excitation characteristic of ϵ′-O2 at 119 GPa, marking the onset of phase coexistence. (d) Representative Raman spectra from the compression of bulk O2 (see the panel inset), up to 225 GPa. To demonstrate the observed strong Raman resonance of the L2 mode at high pressures, spectra from excitation wavelengths of 532 and 660 nm are shown. The 25× intensity enhancement of L2 has been calculated based on a normalization procedure from the Raman intensity of the unstressed diamond edge.

    Perhaps the most striking property of the vibrational spectrum of ζ-O2 is its simplicity when compared with the precursory phase ϵ-O2. Here, only seven excitations, namely, six lattice modes (L1, …, L6) and one vibrational mode (ν1), can be attributed to ζ-O2. This is in stark contrast to the ϵ-O2 phase, which has as many as 12 Raman-active modes,13,15,19 which include an additional vibrational mode (ν2). Typically, the reduction in the number of modes is indicative of a transition to a more simple structure, either to a higher symmetry Bravais lattice or a reduction in the number of molecules in the unit cell. The oxygen vibrational mode ν1 of ζ-O2 was found to coexist and be downshifted by only 9 cm−1 (0.5%) relative to the corresponding mode in the precursory ϵ-O2 phase and has a remarkably similar pressure dependence, as can be seen in Fig. S3 (supplementary material). Further, the preservation of the O2 molecular vibrational mode up to pressures of at least 225 GPa, where it exhibits only a moderate decline in intensity, is in good agreement with ab initio density functional theory (DFT) calculations that report the O2 molecule to be stable to at least 1.9 TPa.20 Apart from the disappearance of L1, discussed in Sec. II B, all observed modes for ζ-O2 are found to remain well defined and to evolve continuously with pressure, increasing in frequency, suggesting that there is instability in the underlying structures up to at least 225 GPa. Owing to the proximity of modes L4, L5, and L6 between 125 and 150 GPa, their pressure evolution was hard to determine, but assuming the absence of discontinuities in their pressure evolution, the crossing is clarified by the respective arrows in Fig. 1(a).

    As the distinct vibrational spectra and pressure evolution of ζ-O2, as seen in Fig. 1, have now been constrained, it becomes possible to compare with energetically competitive candidate models. This has been attempted before,13,14 but owing to the coexistence of precursory phases and the broad/weak Raman response of metallic oxygen, it is challenging to make robust comparisons. For reference, Fig. S2(c) (supplementary material) presents an example of a spectrum obtained from data used for a previous evaluation of a candidate model13,15 and from the present study. From previous ab initio calculations, which have been repeated in the present study, two energetically competitive (within 2 meV/molecule13) monoclinic structures were found to be stable in the stability field of ζ-O2, namely, the C2/m and C2/c structures, with four and two molecules in their primitive unit cells, respectively. Phonon calculations for the C2/m structure revealed the appearance of an imaginary frequency at pressures above about 210 GPa, which indicates a distortion to a triclinic structure, Ci. Like the C2/c structure, the Ci structure also contains two molecules in its primitive unit cell. The instability predicted by calculations for the candidate models containing four O2 molecules in their primitive cell is fascinating and could give insight into the fate of the (O2)4 units. A summary of the optimized structural parameters of the primitive unit cells of these candidate structures can be found in Table S1 (supplementary material). A comparison of calculated Raman-active modes with experimental observations can be seen in Figs. 2(a)2(c) for the C2/m, C2/c, and Ci candidate structures, respectively. What is remarkable is the similarity between these structures, which have not only very similar Raman activity but also very similar expected Bragg reflections, as can be seen in Fig. 2(d), which can make them hard to differentiate experimentally. In particularly close agreement are the C2/c and the newly found Ci structures, which have an identical number of Raman-active modes (although of different symmetries), which differ in frequency by at most a few percent, as can be seen in Figs. S1(b) and S1(c) (supplementary material). In addition, generated powder diffraction patterns show similar d-spacings and reflection intensities strongly suggesting structural similarities. It is therefore not unlikely that this new Ci structure could be a triclinic distortion of the monoclinic C2/c structure and an artifact of the calculations carried out harmonically, which may be resolved when the quantum and thermal anharmonic motion of the nuclei are taken into account.

    ζ-O2 structural and vibrational compatibility with candidate structures. (a)–(c) Experimentally measured and fitted pressure evolution of excitations (L1, …, L6 and ν1) up to 225 GPa [Fig. 1(b)] plotted with the simulated Raman frequencies from the candidate structures: (a) C2/m; (b) C2/c; (c) Ci. (d) Integrated x-ray diffraction pattern of a laser-heated O2–He mixture at 140 GPa. The red blue, and green ticks indicate calculated reflections from the C2/m, C2/c, and Ci candidates structures, respectively, optimized at 140 GPa (structural details are provided in Table S1 in the supplementary material). The purple and gray index ticks indicated Bragg reflections from helium (140 GPa21) and rhenium (145 GPa22), respectively.

    Figure 2.ζ-O2 structural and vibrational compatibility with candidate structures. (a)–(c) Experimentally measured and fitted pressure evolution of excitations (L1, …, L6 and ν1) up to 225 GPa [Fig. 1(b)] plotted with the simulated Raman frequencies from the candidate structures: (a) C2/m; (b) C2/c; (c) Ci. (d) Integrated x-ray diffraction pattern of a laser-heated O2–He mixture at 140 GPa. The red blue, and green ticks indicate calculated reflections from the C2/m, C2/c, and Ci candidates structures, respectively, optimized at 140 GPa (structural details are provided in Table S1 in the supplementary material). The purple and gray index ticks indicated Bragg reflections from helium (140 GPa21) and rhenium (145 GPa22), respectively.

    The previously proposed C2/m structure (isostructural to ϵ-O2) for ζ-O2, has oxygen atoms occupying 8j and 4i Wykoff positions, and allows for 12 Raman-active bands (7Ag + 5Bg), far exceeding the number of modes observed here. However, as seen in Fig. 1, the close proximity of many of these excitations implies that they may not be resolvable experimentally. Further, the additional vibrational (ν2) mode could be obscured by the stressed diamond phonon, as seen in Fig. 2. Therefore, only two predicted modes, between 650 and 700 cm−1 at 100 GPa, remain experimentally unexplained. On the other hand, both the C2/c and Ci candidate structures, which have only two molecules in the primitive unit cell, allow for a total of six Raman-active bands and are therefore more compatible with the total number of ζ-O2 excitations experimentally observed, as seen in Fig. 2. However, more critically, both the C2/c and Ci structures lack a low-frequency mode compatible with the experimentally observed L1 excitation and could prove to be the key to distinguishing the more appropriate candidate model. Therefore, given the near-identical nature of the Bragg reflections between candidate structures, as seen in Fig. 2(d) and demonstrating the difficulty encountered in differentiating the structures from powder diffraction, only the observation of L1 allows assignment of the C2/m structure. Curiously, at pressures above 175 GPa, L1 is no longer detectable, resulting in profound consequences for the fate of the (O2)4 units, and this will be discussed in Sec. II B.

    B. Evidence for the dissociation of (O2)4

    The ultimate fate of O8 has given rise to significant speculation. O8 clusters, (O2)4 units, are a beautiful feature in the condensed oxygen system,23 and despite not being anticipated by theory, they demonstrate remarkable stability. These (O2)4 units are found to be stable from 7.6 GPa at 0 K24 to temperatures in excess of 750 K from 44 to 90 GPa25,26 and up to at least 96 GPa at 300 K,7,16 making them perhaps the most prominent feature of the known oxygen phase diagram. The mechanism behind the formation of these clusters, believed to be of Peierls distortion in origin,23 induces a weak chemical bond between a quartet of neighboring O2 molecules forming a rhomboid.11,12 Their remarkable stability on compression is confirmed by a substantial volume reduction of 5.4% with respect to the precursory phase, δ-O2.27 However, on compression, intercluster distances have been reported to become comparable to intracluster distances found at lower pressures,11 which could have profound implications for the stability and suitability of these clusters at higher pressures and in denser O2 phases.

    The preservation of (O2)4 units in the previously proposed structure for ζ-O2, C2/m, is a curious conjecture. In this structure, although it still has four molecules in the primitive unit cell and the same symmetry as ϵ-O2, the shortest intercluster distance, x1 = 2.009 Å, has become shorter than the longest intracluster distance, x2 = 2.03 Å, at 130 GPa,13 as seen in Fig. S4 (supplementary material). This feature, although subtle, is profound. It can be argued that this is indicative of a polymerization of the (O2)4 clusters in chains, (O8)n, that run parallel to the b axis. Polymeric states are not uncommon in oxygen’s Periodic Table group, with α-S8 found to polymerize above 160 °C at ambient pressures, and they are believed to be the mechanism ultimately responsible for finally cleaving the O2 unit.20 By contrast, the C2/c and Ci candidate structures, which have only two molecules in their primitive unit cell, are incompatible with any (O2)4 interpretation. Therefore, if these structures were found to be compatible with experimental observations, this would mean that the (O2)4 units have dissociated. This has been observed previously, with the (O2)4 binding energy being overcome at high temperatures, resulting in a phase transition to a proposed hexagonal arrangement of O2 molecules.25,26 It is important to note that both the C2/c and Ci structures also appear to conform to layers of distorted hexagonal arrangements, not unlike the proposed metallic η′-O2 phase found at lower pressures or the close packed structures found in other simple molecular systems at high pressure.

    Arguably, Raman spectroscopy played the most significant role in the previous assignment of the C2/m structure to the ζ-O2 phase,13–15 largely on the basis of the number of apparent Raman modes present. Here, it should be noted that this established interpretation is compromised owing to the strong coexistence with the precursory ϵ-O2 phase and the nature of the phase transition as described in detail in Sec. II C. However, although the now distinct spectrum of ζ-O2 is much simpler, with only seven modes up to 175 GPa, the C2/m structure is the only candidate structure that provides a satisfactory explanation of all the modes observed in our experiments. Above 175 GPa, the observed Raman spectrum becomes entirely compatible with the expected number of modes and energies from the calculated C2/c and Ci structures, owing to the loss of L1. Therefore, at this pressure, it is unlikely that any vestiges of the (O2)4 clusters that are characteristic of the ϵ-O2 phase and responsible for the C2/m assignment are still present, since these clusters will have become completely dissociated. In addition, at this pressure, the precursory phase, ϵ-O2, is no longer detectable. This interpretation is substantiated by calculations showing that the C2/m structure is distorted to Ci; this instability can be seen in the simulated Raman modes in Fig. 2(a), where above 125 GPa the lowest-frequency Raman mode of the C2/m structure is found to turn over and rapidly decrease in frequency, becoming zero at 210 GPa. Further, we can see from the calculations that this transition is very subtle and is particularly difficult to verify experimentally, with all phases demonstrating similar Bragg reflections and Raman activity, as seen in Fig. 2.

    Perhaps related to this phase transition is an observed Raman resonance of the L2 mode with excitation energy 1.88 eV (660 nm), where an enhancement of up to 25 times at 225 GPa is reached compared with the Raman excitation by 2.33 eV (532 nm), as seen in Fig. 1(d). This observed resonance results in a substantial Raman response for a metallic system, since the L2 mode is found to be more intense than the unstressed diamond optical phonon and 84 times stronger than the optical phonon of the surrounding metallic (rhenium) gasket. Raman resonance, although unusual in metallic systems, is not uncommon in molecular systems in the vicinity of an insulator-to-metallic transition and has been observed in hydrogen in its semiconducting states9,28–30 en route to its elusive metallic form.2 The resonance found in metallic oxygen, which was found to increase with pressure above 150 GPa, is a clear indication that although the system remains metallic, there is a continued modification in the underlying electronic structure.

    At pressures above 175 GPa, it is also seen from numerical calculations that the Raman-active phonons assigned to L2 are found to soften, and if this trend were to continue, then these phonons would become imaginary at higher pressures. This behavior, which was not observed experimentally, is indicative that yet another phase transition could be expected at higher pressures. Recent calculations and experimental observations suggest that the high temperature η′-O2 (P63/mmc) phase,25,26 found at lower pressures, could be stable at room temperature at these pressures. Further, in agreement with this interpretation, a P63/mmc O2 phase was reported to be energetically competitive at 0.5 TPa20 and would act as the precursor to polymeric oxygen states in which the O2 molecule is finally broken.

    C. Complex phase behavior

    In all experiments, the evolution of the oxygen Raman spectrum at room temperature up to 130 GPa is consistent with previous reports,14,15,19,23 as can be seen in Fig. S2 (supplementary material). Although a reduction in Raman intensity occurs at 95 GPa, owing to the onset of molecular metallization,1,5 excitations attributed to the lower-pressure ϵ-phase continue to dominate the Raman spectrum of oxygen up to 130 GPa and can be detected to pressures as high as 175 GPa, as seen in Figs. 1 and 2, and S2. The preservation of ϵ-O2 up to densities far beyond the confirmed metallization of bulk oxygen1,5 leads to an intriguing proposition, namely, that the transition to the metallic state may not require the structural transition to ζ-O2.7 Such behavior is not uncommon in simple diatomic molecular systems, having famously been exhibited by the halogens3,4 and previously suggested for oxygen, where a change in reflectivity of the single-crystal was observed, indicative of the onset of metallization, with no obvious discontinuity in the O2 vibrational mode.31 Further support for the metallic form of ϵ-O2, denoted as ϵ′-O2 in this study, can be seen in the micrograph of a sample at 130 GPa shown in Fig. 3. Here, although the relative intensities of ζ-O2 (discussed previously) and ϵ′-O2 excitations are present across the surface of the metallic crystal, there are no associated visual differences in luster, suggesting a similar metallic behavior in both phases. However, further complementary investigations, including mid-infrared reflectivity and electrical measurements, will be required to obtain definitive proof of the existence of a metallic form of ϵ-O2.

    Raman map of an originally ϵ-O2 single crystal. (a) Micrograph, taken in reflective and transmitted light at a pressure of 130 GPa, of a sample of a large oxygen crystal that was grown at 20 GPa and 150 °C in a helium pressure-transmitting medium. The right panel is a magnified view of the originally ϵ-O2 single crystal, with colored markers corresponding to the Raman spectra in (b) and with the points representing a line scan with 3 μm spacing. (b) Color-coded Raman spectrum corresponding to the Raman mapping in (a). The black and red ticks at the bottom denote excitations representative of ζ-O2 and ϵ-O2, respectively.

    Figure 3.Raman map of an originally ϵ-O2 single crystal. (a) Micrograph, taken in reflective and transmitted light at a pressure of 130 GPa, of a sample of a large oxygen crystal that was grown at 20 GPa and 150 °C in a helium pressure-transmitting medium. The right panel is a magnified view of the originally ϵ-O2 single crystal, with colored markers corresponding to the Raman spectra in (b) and with the points representing a line scan with 3 μm spacing. (b) Color-coded Raman spectrum corresponding to the Raman mapping in (a). The black and red ticks at the bottom denote excitations representative of ζ-O2 and ϵ-O2, respectively.

    Above 100 GPa, new weak and broad Raman bands emerge and are found to coexist with modes attributed to ϵ′-O2. These features, which have been reported previously, have been assigned to ζ-O2, implying that the process of metallization is not associated with molecular dissociation.15 Unfortunately, owing to the strong overlap with the coexisting ϵ′-O2 phase and the weak Raman response from metals, these modes have remained poorly constrained. At pressures above 110 GPa, remarkable changes are found when metallic oxygen undergoes laser heating. These transformations, which are shown in Fig. 4, are observed both visually and spectroscopically. In the process of laser heating, a clear change was observed in the sample morphology, which turned from well-defined oxygen crystallites into a fine powder dispersed within the surrounding helium pressure medium, as shown in Fig. 4. This change in morphology occurred with no visible black body emission and relatively low laser powers (10 W), suggesting that annealing temperatures remained below 1000 K and therefore did not reach the melting conditions for either oxygen or the surrounding helium. After relatively moderate laser heating, a significant enhancement of the Raman signal was observed, with the formerly weak and broad excitations attributed to ζ-O2 becoming sharp and well resolved, as can be seen in Fig. 4(a), while overlapping peaks assigned to ϵ′-O2 were lost. Thus, the distinct vibrational signatures of ζ-O2, shown in Figs. 1 and 2, and of ζ-O2 could be seen. The enhancement of the Raman response can be correlated with the change in sample morphology, for two main reasons: (1) the suspension of a fine powder in helium will remove local deviatoric stresses on the oxygen crystals, which may broaden/weaken Raman excitations, and (2) the surface area, to which the Raman probe is sensitive, increases substantially. A similar Raman enhancement correlated with diminishing particle sizes has previously been reported in crystalline powders and has been largely attributed to a diffuse scattering mechanism.32,33 The profound change in sample morphology is intriguing and indicative of significant rearrangements of the oxygen molecules and therefore the associated crystalline domains. This unusual behavior is likely a consequence of the rapid dissociation and recombination of (O2)4 units from the excursion to the high-temperature η′-O2 phase during laser heating, as has been reported previously at lower pressures.25 The novelty and unprecedented quality of the ζ-O2 Raman spectrum can provide profound new insights into the elusive nature of metallic oxygen and has been discussed in Sec. II B.

    Effects of laser heating on coexistence of ζ-O2 and ϵ′-O2 at 130 GPa. (a) Representative Raman spectra of O2 before (blue curve) and after (black curve) laser heating. The blue curve is representative of an O2 sample exhibiting coexistence of both ζ-O2 and ϵ′-O2, and the tick marks identify the characteristic excitations. The black curve is representative of pure ζ-O2, with no excitations characteristic of ϵ′-O2 being observable. (b) and (c) Micrographs of O2 crystallites in helium respectively before and after laser heating. The images were taken in both reflected and transmitted light.

    Figure 4.Effects of laser heating on coexistence of ζ-O2 and ϵ′-O2 at 130 GPa. (a) Representative Raman spectra of O2 before (blue curve) and after (black curve) laser heating. The blue curve is representative of an O2 sample exhibiting coexistence of both ζ-O2 and ϵ′-O2, and the tick marks identify the characteristic excitations. The black curve is representative of pure ζ-O2, with no excitations characteristic of ϵ′-O2 being observable. (b) and (c) Micrographs of O2 crystallites in helium respectively before and after laser heating. The images were taken in both reflected and transmitted light.

    Compression along the room temperature isotherm to pressures above 175 GPa also results in a Raman spectrum of ζ-O2, with no modes characteristic of ϵ′-O2 being observed. In addition, the Raman responses from these experiments on decompression are identical to those from the previously discussed laser-heated samples, as seen in Fig. 3 and in Fig. S2 (supplementary material). These experimental runs can serve as control experiments where the absence of laser heating can rule out any possible chemical reaction between oxygen and surrounding materials, such as rhenium, diamond, and helium. Given the identical nature between the results of unheated samples with samples which were laser heated, it is unlikely that exotic chemistry has taken place. Therefore, the laser heating was found only to provide thermal energy required to overcome kinetic barriers eliminating the metastable ϵ′-O2 at pressures greater than 110 GPa.

    The observed strong coexistence between the ϵ′-O2 and ζ-O2, which almost doubles the known stability field of the precursory ϵ(ϵ′)-O2 phase, and the behavior on laser heating, can give insight into the nature of the ϵ′–ζ transition. This complex phase behavior, summarized in Fig. 5, is indicative of a first-order/structural transition, which is at odds with the concepts of displacive and/or second-order transitions that were previously used to describe the nature of the ϵ′–ζ transition.14,16 However, whether the ϵ′–ζ phase transition is isostructural, involving the C2/m phase as suggested by calculations,13 and the fate of the fascinating (O2)4 units, remain to be established, as discussed previously.

    Hysteresis and coexistence of ζ-O2 and ϵ′-O2 on compression and decompression. (a) Top: one-dimensional phase diagrams of oxygen along the room-temperature isotherm on compression and decompression up to 225 GPa. The dashed line indicates the established metallization pressure of bulk oxygen.1,5 Bottom: proposed evolution of candidate models, evidence for which is provided in Secs. II A and II B, with their respective numbers of O2 molecules in the primitive unit cell for metallic oxygen beyond the precursory ϵ-O2 phase. (b) Representative Raman spectra of the coexistent metallic phases of oxygen, ϵ′-O2 and ζ-O2, on decompression after laser heating in helium at 130 GPa. The black, blue, and red curves are Raman spectra from ζ-O2, ϵ′-O2 + ζ-O2 and ϵ′-O2, respectively. Black and red ticks correspond to the excitations from ζ-O2 and ϵ′-O2, respectively.

    Figure 5.Hysteresis and coexistence of ζ-O2 and ϵ′-O2 on compression and decompression. (a) Top: one-dimensional phase diagrams of oxygen along the room-temperature isotherm on compression and decompression up to 225 GPa. The dashed line indicates the established metallization pressure of bulk oxygen.1,5 Bottom: proposed evolution of candidate models, evidence for which is provided in Secs. II A and II B, with their respective numbers of O2 molecules in the primitive unit cell for metallic oxygen beyond the precursory ϵ-O2 phase. (b) Representative Raman spectra of the coexistent metallic phases of oxygen, ϵ′-O2 and ζ-O2, on decompression after laser heating in helium at 130 GPa. The black, blue, and red curves are Raman spectra from ζ-O2, ϵ′-O2 + ζ-O2 and ϵ′-O2, respectively. Black and red ticks correspond to the excitations from ζ-O2 and ϵ′-O2, respectively.

    III. CONCLUSION AND OUTLOOK

    We have conducted a systematic study of oxygen up to 225 GPa through (1) compression of O2 in helium, (2) compression of O2 in helium with laser heating, and (3) compression of bulk O2. Through the course of these experiments, we have identified a strong metastability with precursory ϵ′-O2, which appears to be preserved up to pressures of 175 GPa and, critically, could have affected the interpretation of existing diffraction data.14,16 For the first time since the discovery of ζ-O2 over 30 years ago, we have recorded its distinct vibrational signature, which can be found either through the compression of oxygen to pressures greater than 175 GPa at room temperature or via laser heating oxygen crystals in helium at pressures greater than 110 GPa. Through a comparison with our numerical simulations, the obtained vibrational frequencies for ζ-O2 agree well with the C2/m candidate structure. However, at higher pressures, above 175 GPa, simpler candidate structures with only two molecules in their primitive unit cells, C2/c and Ci, appear to be more appropriate, enticingly suggesting a density-driven dissociation of the (O2)4 units. Finally, the mapped phase behavior and strong coexistence found in the metallic phases will help guide future studies of the physical properties of these phases and perhaps the long-awaited structural refinement of ζ-O2.

    SUPPLEMENTARY MATERIAL

    ACKNOWLEDGMENTS

    Acknowledgment. We would like to thank Huichao Zhang, Huixin Hu, and Yuchen Yu for their assistance in the laboratory and during sample loadings, as well as Eugene Gregoryanz for useful discussions. Bartomeu Monserrat acknowledges support from a UKRI Future Leaders Fellowship (Grant No. MR/V023926/1), from the Gianna Angelopoulos Programme for Science, Technology, and Innovation, and from the Winton Programme for the Physics of Sustainability. Federico Gorelli acknowledges support from the Shanghai Science and Technology Committee, China (Grant No. 22JC1410300) and the Shanghai Key Laboratory of Novel Extreme Condition Materials, China (Grant No. 22dz2260800). Portions of this work were performed on beamline ID27 at the European Synchrotron Radiation Facility (ESRF) (Proposal Nos. CH6636 and CH6300), Grenoble, France as well as preliminary investigations on beamline 15U1 at the Shanghai Synchrotron Radiation Facility (SSRF), Shanghai, People’s Republic of China. We would like to thank our beamline contacts Mohamed Mezouar and Gaston Garbarino for their assistance during the course of the x-ray diffraction data collection. The computational resources were provided by the Cambridge Tier-2 system operated by the University of Cambridge Research Computing Service and funded by the UK EPSRC (Grant No. EP/P020259/1).

    References

    [1] A. L.Ruoff, Y. K.Vohra, S.Desgreniers. J. Phys. Chem., 94, 1117(1990).

    [2] H. B.Huntington, E.Wigner. J. Chem. Phys., 3, 764(1935).

    [3] A. S.Balchan, H. G.Drickamer. J. Chem. Phys., 34, 1948(1961).

    [4] F.Hiroshi, T.Kenichi, O.Mitsuko, S.Kyoko. Nature, 423, 971(2003).

    [5] K.Shimizu, K.Amaya, M. I.Eremets, K.Suhara, M.Ikumo. Nature, 393, 767(1998).

    [6] Y.Akahama, H.Fukui, N.Hiraoka, N.Hirao, L. T.Anh, M.Wada, T.Iitaka, T.Irifune. Proc. Natl. Acad. Sci. U. S. A., 116, 21385(2019).

    [7] M.Hanfland, O.Shimomura, D.H?usermann, Y.Akahama, H.Kawamura. Phys. Rev. Lett., 74, 4690(1995).

    [8] S. I.Kawaguchi, M. E.Donnelly, M.Pena-Alvarez, R. T.Howie, E.Gregoryanz, M.Wang, A.Hermann, J.Binns, P.Dalladay-Simpson. Sci. Adv., 7, eabi9507(2021).

    [9] P. P.Kong, M. I.Eremets, A. P.Drozdov, H.Wang. Nat. Phys., 15, 1246(2019).

    [10] J. P.Gaspard, A.San Miguel, J. P.Itié, H.Libotte, A.Polian, M.Gauthier. Eur. Phys. J. B, 17, 227(2000).

    [11] Y.Akahama, H.Yamawaki, Y.Gotoh, H.Fujihisa, K.Honda, O.Shimomura, M.Sakashita, H.Kawamura, S.Takeya, Y.Ohishi. Phys. Rev. Lett., 97, 085503(2006).

    [12] L. F.Lundegaard, M. I.McMahon, G.Weck, P.Loubeyre, S.Desgreniers. Nature, 443, 201(2006).

    [13] A. R.Oganov, Y.Ma, C. W.Glass. Phys. Rev. B, 76, 064101(2007).

    [14] P.Loubeyre, S.Desgreniers, M.Mezouar, G.Weck. Phys. Rev. Lett., 102, 255503(2009).

    [15] G.Shen, R.Hemley, H. K.Mao, A.Goncharov, M.Somayazulu, E.Gregoryanz. Phys. Rev. B, 68, 224108(2003).

    [16] G.Weck, R.LeToullec, P.Loubeyre. Phys. Rev. Lett, 88, 035504(2002).

    [17] E.Burstein, A. A.Maradudin, D. L.Mills. Ann. Phys., 56, 504(1970).

    [18] J. H.Parker, D. W.Feldman, M.Ashkin. Phys. Rev. Lett., 21, 607(1968).

    [19] H.Kawamura, Y.Akahama. Phys. Rev. B, 54, R15602(1996).

    [20] D. D.Klug, C. J.Pickard, M.Martinez-Canales, J.Sun, R. J.Needs. Phys. Rev. Lett., 108, 045503(2012).

    [21] Y.Ohishi, H. P.Liermann, S.Duwal, J.Lim, C. S.Yoo, J. S.Tse, M.Kim, S.Kawaguchi, R.Hrubiak. Phys. Rev. B, 101, 224103(2020).

    [22] W. A.Bassett, C. S.Zha, S. H.Shim. Rev. Sci. Instrum., 75, 2409(2004).

    [23] Y.Crespo, H. J.Jodl, Y. A.Freiman. Phys. Rep., 743, 1(2018).

    [24] D.Schiferl, D.Gonzales, W. B.Carter, M. L.Lowe. J. Phys. Chem., 95, 2516(1991).

    [25] R. J.Hemley, T. R.Ravindran, V. B.Prakapenka, A. F.Goncharov, N.Subramanian, M.Somayazulu. J. Chem. Phys., 135, 084512(2011).

    [26] S. F.Elatresh, S. A.Bonev. Phys. Chem. Chem. Phys., 22, 12577(2020).

    [27] R. L.Mills, B.Olinger, R. B.Roof. J. Chem. Phys., 81, 5068(1984).

    [28] P.Dalladay-Simpson, E.Gregoryanz, R. T.Howie. Nature, 529, 63(2016).

    [29] P.López Ríos, E.Gregoryanz, N. D.Drummond, R. T.Howie, P.Dalladay-Simpson, R. J.Needs, B.Monserrat, C. J.Pickard. Phys. Rev. Lett., 120, 255701(2018).

    [30] E.Gregoryanz, C. L.Guillaume, T.Scheler, R. T.Howie, A. F.Goncharov. Phys. Rev. Lett., 108, 125501(2012).

    [31] G.Weck, S.Desgreniers, P.Loubeyre.

    [32] T. J.Vickers, H.Wang, C. K.Mann. Appl. Spectrosc., 56, 1538(2002).

    [33] P. J.Hendra, M. V.Pellow-Jarman, R. J.Lehnert. Vib. Spectrosc., 12, 257(1996).

    Philip Dalladay-Simpson, Bartomeu Monserrat, Li Zhang, Federico Gorelli. Distinct vibrational signatures and complex phase behavior in metallic oxygen[J]. Matter and Radiation at Extremes, 2024, 9(2): 028401
    Download Citation