• Photonics Research
  • Vol. 9, Issue 6, 1144 (2021)
Congping Chen1、2、3、†, Zhongya Qin1、2、3、†, Sicong He1、2、3, Shaojun Liu4、5, Shun-Fat Lau2、6、7, Wanjie Wu1、2、3, Dan Zhu4、5, Nancy Y. Ip2、6、7, and Jianan Y. Qu1、2、3、*
Author Affiliations
  • 1Department of Electronic and Computer Engineering, The Hong Kong University of Science and Technology, Clear Water Bay, Kowloon, Hong Kong, China
  • 2State Key Laboratory of Molecular Neuroscience, The Hong Kong University of Science and Technology, Clear Water Bay, Kowloon, Hong Kong, China
  • 3Center of Systems Biology and Human Health, The Hong Kong University of Science and Technology, Clear Water Bay, Kowloon, Hong Kong, China
  • 4Britton Chance Center for Biomedical Photonics, Wuhan National Laboratory for Optoelectronics, Huazhong University of Science and Technology, Wuhan, China
  • 5MoE Key Laboratory for Biomedical Photonics, Collaborative Innovation Center for Biomedical Engineering, School of Engineering Sciences, Huazhong University of Science and Technology, Wuhan, China
  • 6Division of Life Science, The Hong Kong University of Science and Technology, Clear Water Bay, Kowloon, Hong Kong, China
  • 7Molecular Neuroscience Center, The Hong Kong University of Science and Technology, Clear Water Bay, Kowloon, Hong Kong, China
  • show less
    DOI: 10.1364/PRJ.420220 Cite this Article Set citation alerts
    Congping Chen, Zhongya Qin, Sicong He, Shaojun Liu, Shun-Fat Lau, Wanjie Wu, Dan Zhu, Nancy Y. Ip, Jianan Y. Qu. High-resolution two-photon transcranial imaging of brain using direct wavefront sensing[J]. Photonics Research, 2021, 9(6): 1144 Copy Citation Text show less
    Optimization of the excitation NA and improved wavefront sensing algorithm. (a) Schematic illustration of a high-NA objective in the overfilled (top) and underfilled (bottom) configuration. (b) Monte Carlo simulated SHWS images from the guide star at 250 μm below the thinned skull with full NA and reduced NA of the objective. The dashed circles indicate the apertures for the effective NA of 1.05 and 0.7, respectively. Details are shown in Fig. S2 in Ref. [21]. (c) Simulated wavefront errors and theoretical lateral resolution as functions of effective NA. (d) Representative guide star images of YFP fluorescence in Thy1-YFP mice when the objective was overfilled (left) and underfilled (right) at 250 μm below the thinned skull. Details are shown in Fig. S3 in Ref. [21]. (e) Percentages of bad spots in the Shack–Hartmann spot image for overfilled (blue) and underfilled (red) configurations. A bad spot is the one with poor signal quality (SBR less than 1.2) to make its center unidentifiable. (f) Top: depth-coded images of the NIR-dye labelled microvascular vessels for direct wavefront sensing. Two segments of vessels at different depths (solid line and dashed line labelled with ls 1 and ls 2) were line scanned for wavefront measurement. Scale bar: 10 μm. Bottom: two-photon images of YFP labelled dendrite with system correction only. (g) Top row: guide star images on the SHWS with only ls 1 (left) and our algorithm (right). The right-top corners display the corresponding corrective wavefronts. Bottom row: the corresponding AO corrected images. Details are presented in Fig. S7 in Ref. [21]. Scale bar: 5 μm. (h) Comparisons of the detailed structures of the numbered spots in (g). (i) Intensity profiles along the dashed lines in the bottom panel of (f) and (g).
    Fig. 1. Optimization of the excitation NA and improved wavefront sensing algorithm. (a) Schematic illustration of a high-NA objective in the overfilled (top) and underfilled (bottom) configuration. (b) Monte Carlo simulated SHWS images from the guide star at 250 μm below the thinned skull with full NA and reduced NA of the objective. The dashed circles indicate the apertures for the effective NA of 1.05 and 0.7, respectively. Details are shown in Fig. S2 in Ref. [21]. (c) Simulated wavefront errors and theoretical lateral resolution as functions of effective NA. (d) Representative guide star images of YFP fluorescence in Thy1-YFP mice when the objective was overfilled (left) and underfilled (right) at 250 μm below the thinned skull. Details are shown in Fig. S3 in Ref. [21]. (e) Percentages of bad spots in the Shack–Hartmann spot image for overfilled (blue) and underfilled (red) configurations. A bad spot is the one with poor signal quality (SBR less than 1.2) to make its center unidentifiable. (f) Top: depth-coded images of the NIR-dye labelled microvascular vessels for direct wavefront sensing. Two segments of vessels at different depths (solid line and dashed line labelled with ls 1 and ls 2) were line scanned for wavefront measurement. Scale bar: 10 μm. Bottom: two-photon images of YFP labelled dendrite with system correction only. (g) Top row: guide star images on the SHWS with only ls 1 (left) and our algorithm (right). The right-top corners display the corresponding corrective wavefronts. Bottom row: the corresponding AO corrected images. Details are presented in Fig. S7 in Ref. [21]. Scale bar: 5 μm. (h) Comparisons of the detailed structures of the numbered spots in (g). (i) Intensity profiles along the dashed lines in the bottom panel of (f) and (g).
    AO improves structural and functional brain imaging in vivo through the thinned-skull window. (a) xz maximum-intensity projection (MIP) images of the pyramidal neurons (orange) and microvasculature (red) in Thy1-YFP mice through a thinned-skull window (50 μm in thickness) with system correction only (left) and full AO correction (right). AO corrections was performed every 50 μm of depth. Similar results were performed at 5 sites from 4 mice, for a total n=5. Scale bar: 20 μm. (b) xy MIP of the stack images in (a). Scale bar: 5 μm. (c) Intensity profiles along the dashed lines in (b) with system (blue) and full (red) AO corrections. Lateral resolutions were estimated in terms of full width at half-maximum (FWHM). (d) In vivo imaging of spontaneous activity of neurons and dendrites in the somatosensory cortex of the CaMPK-GCaMP6s mice under light anesthesia. The neurons are shown as standard-deviation (STD) projections of 600 frames recorded at 340 μm below the pia with only system correction (left) or with full AO correction (right). Similar results for n=6. Scale bar: 10 μm. (e) Fluorescence traces for the soma (Sm) and dendrites (Den) as indicated by the dashed circles in (d). Background fluorescence measured from the nearby vessel location was subtracted from the fluorescence signal. (f) In vivo imaging of microglia (green) and microvessels (red) at 350–400 μm below the pia in the Cx3Cr1-GFP mice with system (left) and full (right) AO corrections. Full AO corrections were performed every 40 μm, and 5×5 subregions were stitched together to form the entire image. Similar results for n=5. Scale bar: 20 μm. (g) Magnified views of the boxed region in (d). Scale bar: 10 μm.
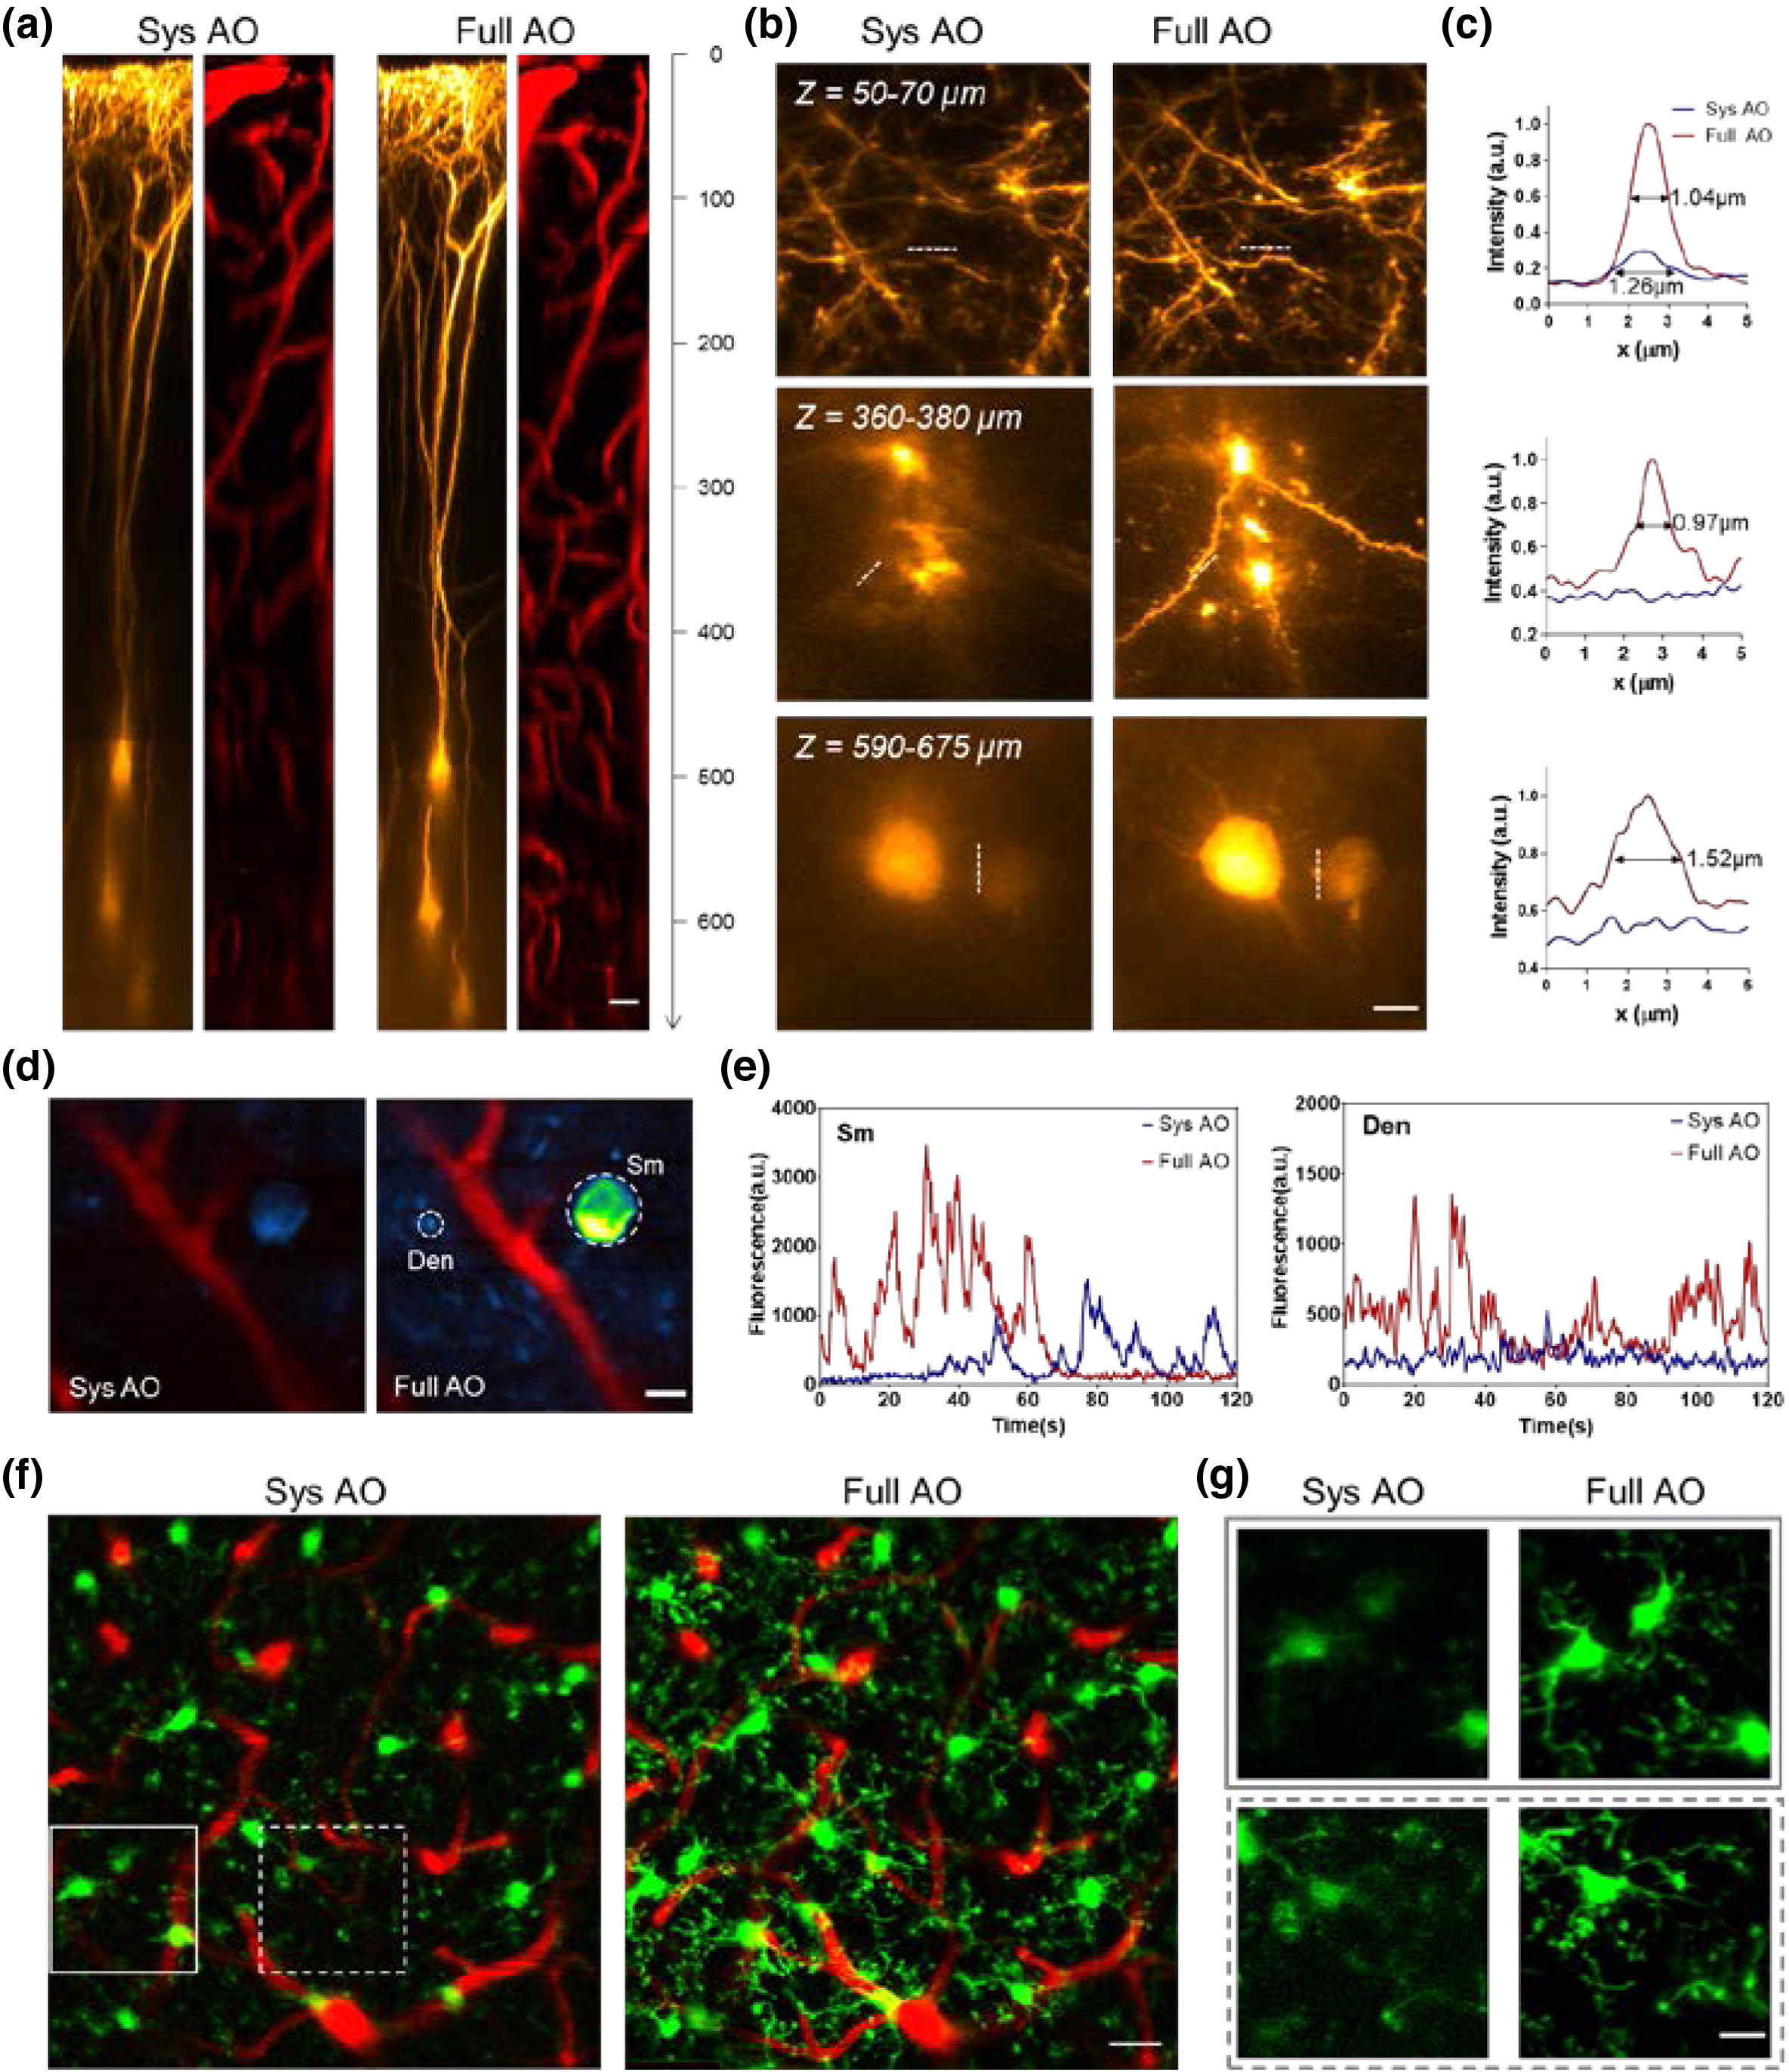
    Fig. 2. AO improves structural and functional brain imaging in vivo through the thinned-skull window. (a) xz maximum-intensity projection (MIP) images of the pyramidal neurons (orange) and microvasculature (red) in Thy1-YFP mice through a thinned-skull window (50 μm in thickness) with system correction only (left) and full AO correction (right). AO corrections was performed every 50 μm of depth. Similar results were performed at 5 sites from 4 mice, for a total n=5. Scale bar: 20 μm. (b) xy MIP of the stack images in (a). Scale bar: 5 μm. (c) Intensity profiles along the dashed lines in (b) with system (blue) and full (red) AO corrections. Lateral resolutions were estimated in terms of full width at half-maximum (FWHM). (d) In vivo imaging of spontaneous activity of neurons and dendrites in the somatosensory cortex of the CaMPK-GCaMP6s mice under light anesthesia. The neurons are shown as standard-deviation (STD) projections of 600 frames recorded at 340 μm below the pia with only system correction (left) or with full AO correction (right). Similar results for n=6. Scale bar: 10 μm. (e) Fluorescence traces for the soma (Sm) and dendrites (Den) as indicated by the dashed circles in (d). Background fluorescence measured from the nearby vessel location was subtracted from the fluorescence signal. (f) In vivo imaging of microglia (green) and microvessels (red) at 350–400 μm below the pia in the Cx3Cr1-GFP mice with system (left) and full (right) AO corrections. Full AO corrections were performed every 40 μm, and 5×5 subregions were stitched together to form the entire image. Similar results for n=5. Scale bar: 20 μm. (g) Magnified views of the boxed region in (d). Scale bar: 10 μm.
    Study of microglial activities in AD mice and neuron–microglial interactions following precise laser micro-lesion. (a) In vivo imaging of amyloid plaque (blue) and microglia (green) at 230–270 μm below the pia in the APP-PS1/Cx3Cr1-GFP mice through a thinned-skull window with system (top) and full (bottom) AO corrections. Full AO correction was performed every 40 μm, and 3×3 subregions were stitched together to form the entire image. Amyloid plaque was labeled by MeO-X04 through intraperitoneal injection. Similar results for n=3. Scale bar: 20 μm. (b) Magnified views of the boxed region in (a) showing the plaque-associated (left) and plaque-distal (right) microglia. Scale bar: 10 μm. (c) 3D reconstruction of pyramidal neurons in Thy1-YFP/Cx3Cr1-GFP mice through a thinned-skull window with full AO correction. Similar results for n=2. (d) and (e) xy MIP images of neuronal dendrites (green) and microglia (magenta) of the boxed region in (c) with (d) system and (e) full AO corrections before laser ablation. Imaging depths: left column, Z=140–180 μm; middle column, Z=180–220 μm; right column, Z=250–290 μm. The bifurcation point of the apical dendrite (Z=200 μm) was targeted for laser microsurgery [thunder symbol in (c) and middle panel of (e)]. The rectangular boxes in the left and right panels of (e) indicate the distal and proximal end of the apical dendrite of the targeted neuron, respectively. (f) Full AO corrected images taken 10 min after laser ablation. The persistence of neurites of a nearby intact neuron [arrowhead in (c) and the middle plane of (f)] indicates the confinement of the laser injury. Scale bar: 10 μm. (g) Characterization of microglial response to the dendritic degeneration. Left and right: microglial surveillance index (black line) and fluorescence decay (green line) of the distal and proximal dendrites [boxed region in the left and right panel of (e)]; middle: influx of microglial processes to the injured spots represented by the microglial fluorescence intensity [dotted circle in the middle panel of (f)] and the fluorescence decay of the injured dendrite [solid circle in the middle panel of (e)].
    Fig. 3. Study of microglial activities in AD mice and neuron–microglial interactions following precise laser micro-lesion. (a) In vivo imaging of amyloid plaque (blue) and microglia (green) at 230–270 μm below the pia in the APP-PS1/Cx3Cr1-GFP mice through a thinned-skull window with system (top) and full (bottom) AO corrections. Full AO correction was performed every 40 μm, and 3×3 subregions were stitched together to form the entire image. Amyloid plaque was labeled by MeO-X04 through intraperitoneal injection. Similar results for n=3. Scale bar: 20 μm. (b) Magnified views of the boxed region in (a) showing the plaque-associated (left) and plaque-distal (right) microglia. Scale bar: 10 μm. (c) 3D reconstruction of pyramidal neurons in Thy1-YFP/Cx3Cr1-GFP mice through a thinned-skull window with full AO correction. Similar results for n=2. (d) and (e) xy MIP images of neuronal dendrites (green) and microglia (magenta) of the boxed region in (c) with (d) system and (e) full AO corrections before laser ablation. Imaging depths: left column, Z=140180  μm; middle column, Z=180220  μm; right column, Z=250290  μm. The bifurcation point of the apical dendrite (Z=200  μm) was targeted for laser microsurgery [thunder symbol in (c) and middle panel of (e)]. The rectangular boxes in the left and right panels of (e) indicate the distal and proximal end of the apical dendrite of the targeted neuron, respectively. (f) Full AO corrected images taken 10 min after laser ablation. The persistence of neurites of a nearby intact neuron [arrowhead in (c) and the middle plane of (f)] indicates the confinement of the laser injury. Scale bar: 10 μm. (g) Characterization of microglial response to the dendritic degeneration. Left and right: microglial surveillance index (black line) and fluorescence decay (green line) of the distal and proximal dendrites [boxed region in the left and right panel of (e)]; middle: influx of microglial processes to the injured spots represented by the microglial fluorescence intensity [dotted circle in the middle panel of (f)] and the fluorescence decay of the injured dendrite [solid circle in the middle panel of (e)].
    AO recovers high-resolution imaging of the cortex through an optical clearing window. (a) xz MIP of two-photon images of the YFP labelled neurons in the six-week-old Thy1-YFP mice before (left) and after (right) optical clearing. Scale bar: 50 μm. Bottom row shows the xy MIP of the stack images. Similar results for n=3. Scale bar: 20 μm. (b) xz MIP images of the pyramidal neurons in Thy1-YFP mice through the optical clearing window with system (left) and full (right) AO corrections. AO correction was performed at every 50 μm depth. Scale bar: 20 μm. (c) xy MIP of the stack images in (b) at two representative depths and the corresponding corrective wavefront and intensity profiles along the dashed lines. Scale bar: 10 μm. (d) In vivo imaging of microglia (green) and microvessels (red) at 175–225 μm below the pia in the Cx3Cr1-GFP mice with system (top) and full (bottom) AO corrections. Full AO corrections were performed every 40 μm, and 3×3 subregions were stitched together to form the entire image. Similar results for n=3. Scale bar: 20 μm. (e) Magnified views of images of the boxed regions in (d). Scale bar: 10 μm.
    Fig. 4. AO recovers high-resolution imaging of the cortex through an optical clearing window. (a) xz MIP of two-photon images of the YFP labelled neurons in the six-week-old Thy1-YFP mice before (left) and after (right) optical clearing. Scale bar: 50 μm. Bottom row shows the xy MIP of the stack images. Similar results for n=3. Scale bar: 20 μm. (b) xz MIP images of the pyramidal neurons in Thy1-YFP mice through the optical clearing window with system (left) and full (right) AO corrections. AO correction was performed at every 50 μm depth. Scale bar: 20 μm. (c) xy MIP of the stack images in (b) at two representative depths and the corresponding corrective wavefront and intensity profiles along the dashed lines. Scale bar: 10 μm. (d) In vivo imaging of microglia (green) and microvessels (red) at 175–225 μm below the pia in the Cx3Cr1-GFP mice with system (top) and full (bottom) AO corrections. Full AO corrections were performed every 40 μm, and 3×3 subregions were stitched together to form the entire image. Similar results for n=3. Scale bar: 20 μm. (e) Magnified views of images of the boxed regions in (d). Scale bar: 10 μm.
    Congping Chen, Zhongya Qin, Sicong He, Shaojun Liu, Shun-Fat Lau, Wanjie Wu, Dan Zhu, Nancy Y. Ip, Jianan Y. Qu. High-resolution two-photon transcranial imaging of brain using direct wavefront sensing[J]. Photonics Research, 2021, 9(6): 1144
    Download Citation