• Acta Optica Sinica
  • Vol. 42, Issue 2, 0206001 (2022)
Xiaobo Li1, Hailong Wang1、*, Linan Ma1, and Qian Gong2
Author Affiliations
  • 1Shandong Provincial Key Laboratory of Laser Polarization and Information Technology, School of Physics and Engineering, Qufu Normal University, Qufu, Shandong 273165, China
  • 2Key Laboratory of Terahertz Solid-State Technology, Shanghai Institute of Microsystem and Information Technology, Chinese Academy of Sciences, Shanghai 200050, China
  • show less
    DOI: 10.3788/AOS202242.0206001 Cite this Article Set citation alerts
    Xiaobo Li, Hailong Wang, Linan Ma, Qian Gong. Wavelength Conversion Characteristics of Quantum-Dot Semiconductor Optical Amplifier Based on Photonic Crystal[J]. Acta Optica Sinica, 2022, 42(2): 0206001 Copy Citation Text show less
    Three-level structural diagram of QD-SOA
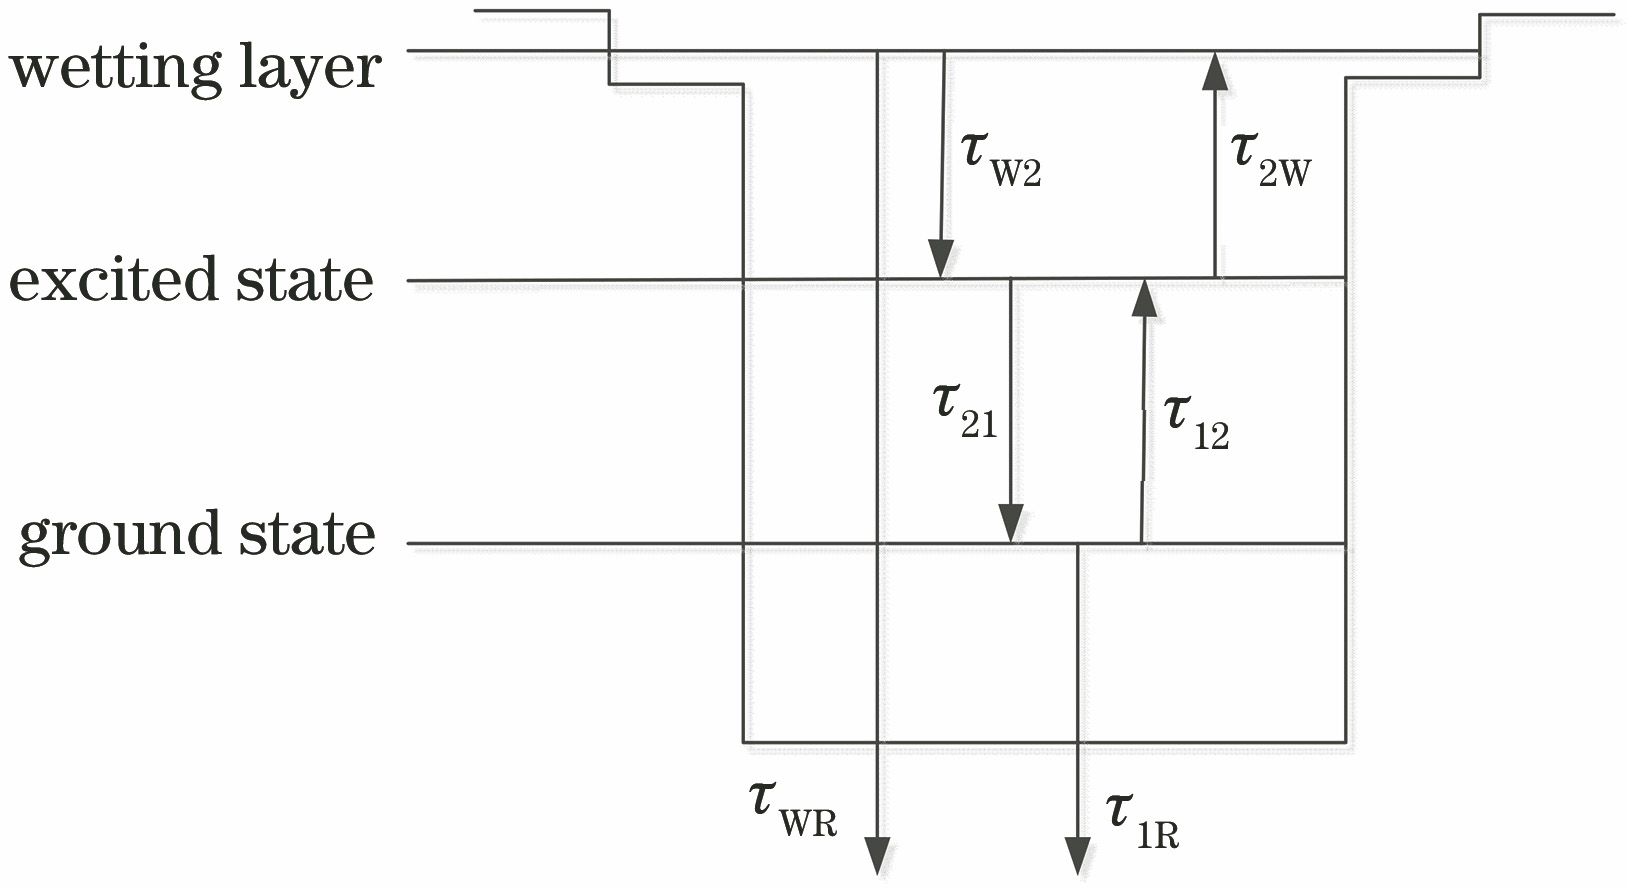
    Fig. 1. Three-level structural diagram of QD-SOA
    Structural diagram of PC-QDSOA
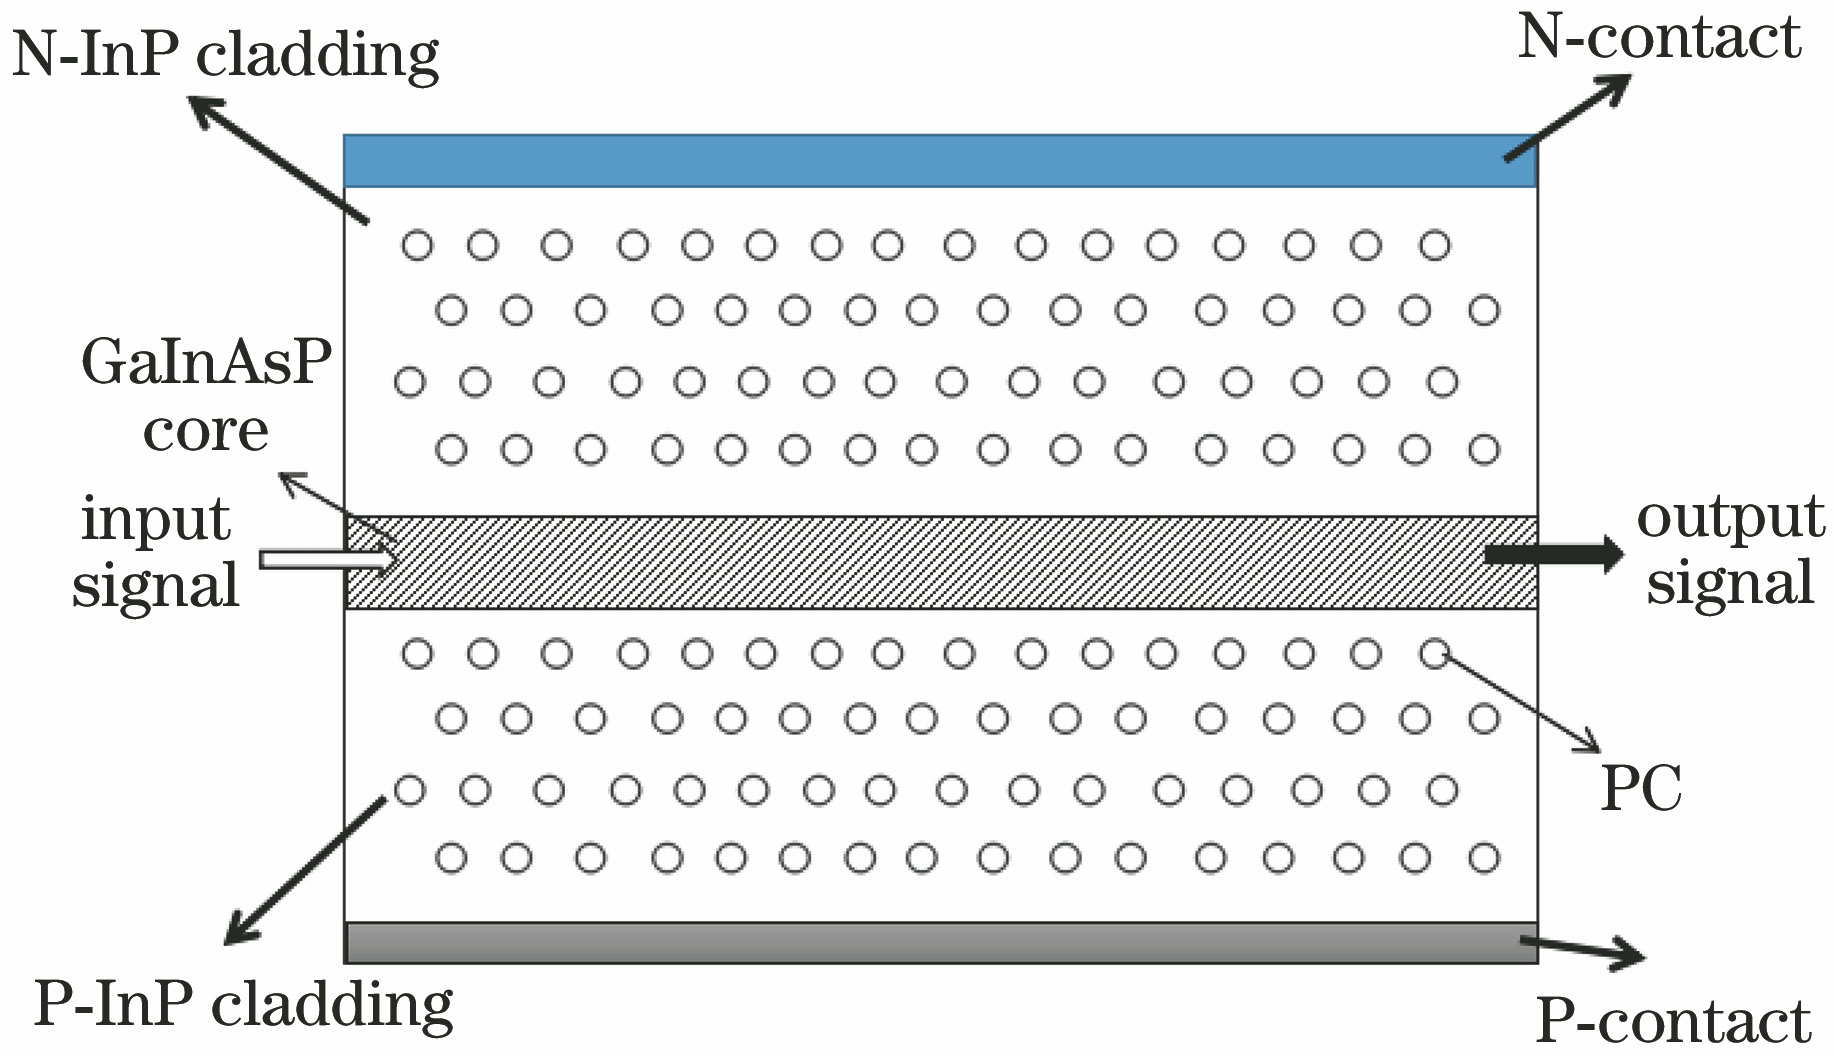
    Fig. 2. Structural diagram of PC-QDSOA
    Wavelength conversion schematic of PC-QDSOA
    Fig. 3. Wavelength conversion schematic of PC-QDSOA
    Input and output waveforms of PC-QDSOA for wavelength conversion. (a) Input pump light waveform; (b) input probe light waveform; (c) output pump light waveform; (d) output probe light waveform
    Fig. 4. Input and output waveforms of PC-QDSOA for wavelength conversion. (a) Input pump light waveform; (b) input probe light waveform; (c) output pump light waveform; (d) output probe light waveform
    Relationship between maximum mode gain and Q factor
    Fig. 5. Relationship between maximum mode gain and Q factor
    Relationship between pump power and Q factor
    Fig. 6. Relationship between pump power and Q factor
    Relationship between probe power and Q factor
    Fig. 7. Relationship between probe power and Q factor
    Relationship between length of active region and Q factor
    Fig. 8. Relationship between length of active region and Q factor
    Relationship between injection current and extinction ratio
    Fig. 9. Relationship between injection current and extinction ratio
    Relationship between pump power and extinction ratio
    Fig. 10. Relationship between pump power and extinction ratio
    Relationship between probe power and extinction ratio
    Fig. 11. Relationship between probe power and extinction ratio
    Relationship between length of active region and extinction ratio
    Fig. 12. Relationship between length of active region and extinction ratio
    ParameterDescriptionValue
    hPlanck contant6.626×10-34 J·s-1
    eElectron charge1.6×10-19 C
    cLight speed in vacuum2.99792458×108 m·s-1
    LWEffective thickness of active layer0.2 μm
    NQSurface density of QDs5×1014 cm
    τW2Electron relaxation time from WL to ES3 ps
    τ21Electron escape time from ES to WL0.16 ps
    τWRSpontaneous radiative lifetime in WL2 ns
    τ1RSpontaneous radiative lifetime in GS0.4 ns
    τ12Electron escape time from GS to ES1 ps
    τ2WElectron escape time from ES to WL1 ns
    ηLine width enhancement factor0.1
    αintLoss coefficient of light320
    r1The first facet reflectivity0
    r2The second facet reflectivity0
    vgGroup velocity of light108 m·s-1
    RRadiation loss0.001 cm
    EsatSaturation energy0.07 pJ
    τCCarrier lifetime20 ps
    τCHTemperature relaxation rate0.3 ps
    τSHBCarrier-carrier scattering rate0.1 ps
    εCHCH nonlinear gain suppression factor0.02 W-1
    εSHBSHB nonlinear gain suppression factor0.02 W-1
    Table 1. Parameter selection table of PC-QDSOA
    Xiaobo Li, Hailong Wang, Linan Ma, Qian Gong. Wavelength Conversion Characteristics of Quantum-Dot Semiconductor Optical Amplifier Based on Photonic Crystal[J]. Acta Optica Sinica, 2022, 42(2): 0206001
    Download Citation