• Acta Optica Sinica
  • Vol. 40, Issue 1, 0111017 (2020)
Jing Guo1, Peng Feng1、2、*, Luzhen Deng1, Yan Luo1, Peng He1、2、**, and Biao Wei1、2
Author Affiliations
  • 1Key Laboratory of Optoelectronics Technology & System, Ministry of Education, Chongqing University, Chongqing 400044, China;
  • 2Industrial CT Non-destructive Testing Engineering Research Center, Ministry of Education, Chongqing University, Chongqing 400044, China
  • show less
    DOI: 10.3788/AOS202040.0111017 Cite this Article Set citation alerts
    Jing Guo, Peng Feng, Luzhen Deng, Yan Luo, Peng He, Biao Wei. Optimization of Detection Angle for Pinhole X-Ray Fluorescence Computed Tomography[J]. Acta Optica Sinica, 2020, 40(1): 0111017 Copy Citation Text show less
    Diagram of XFCT with pinhole collimator
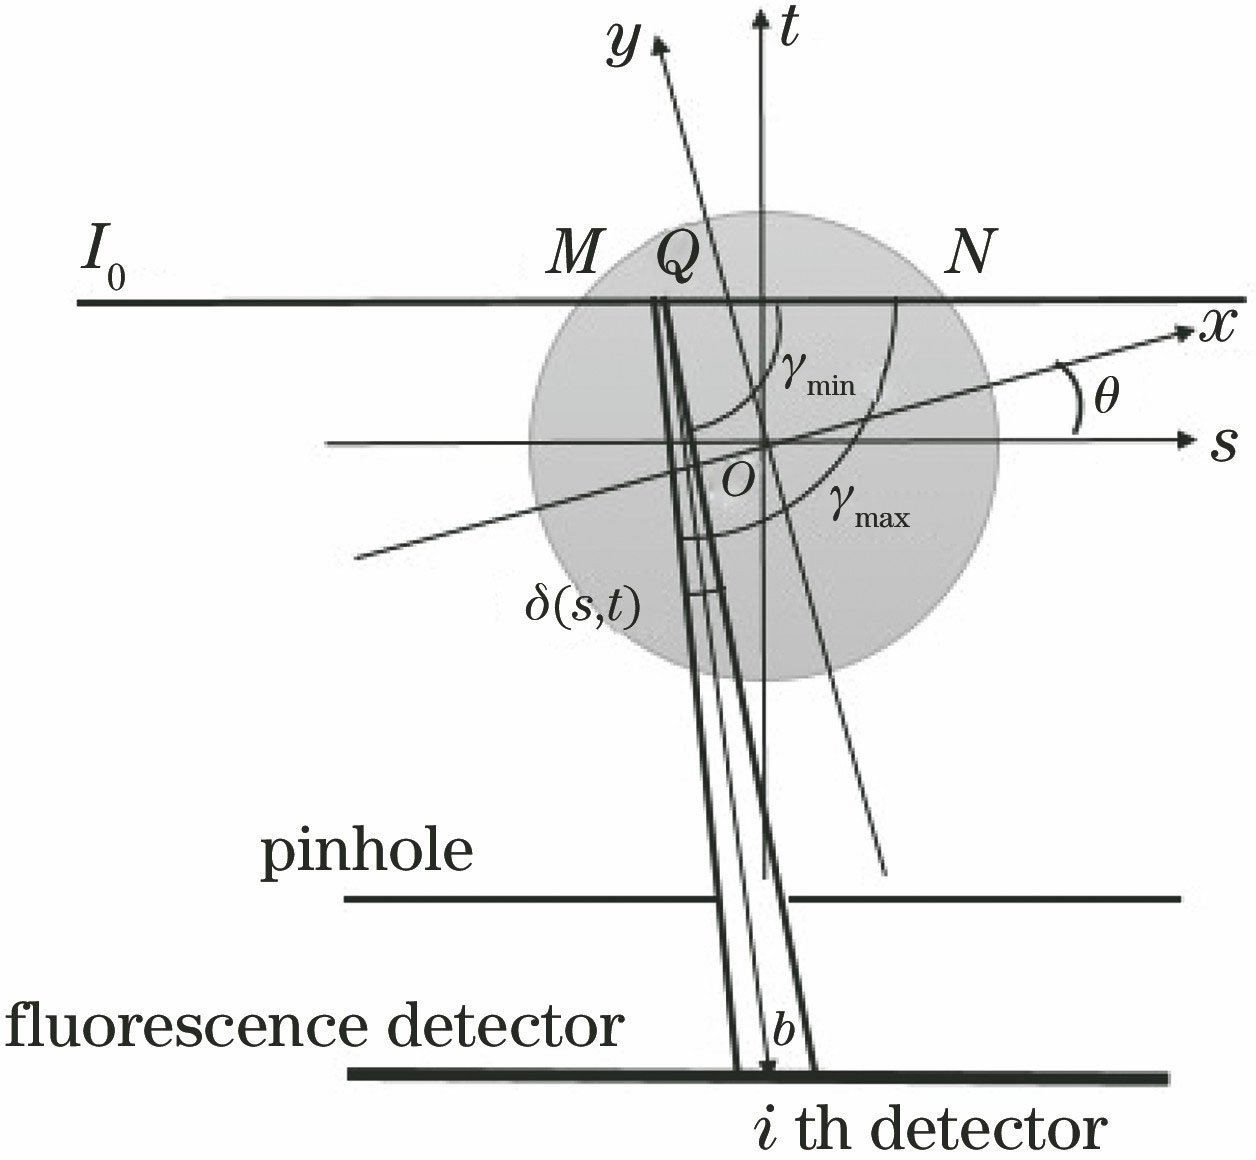
    Fig. 1. Diagram of XFCT with pinhole collimator
    Schematic of multi-pinhole XFCT MC model
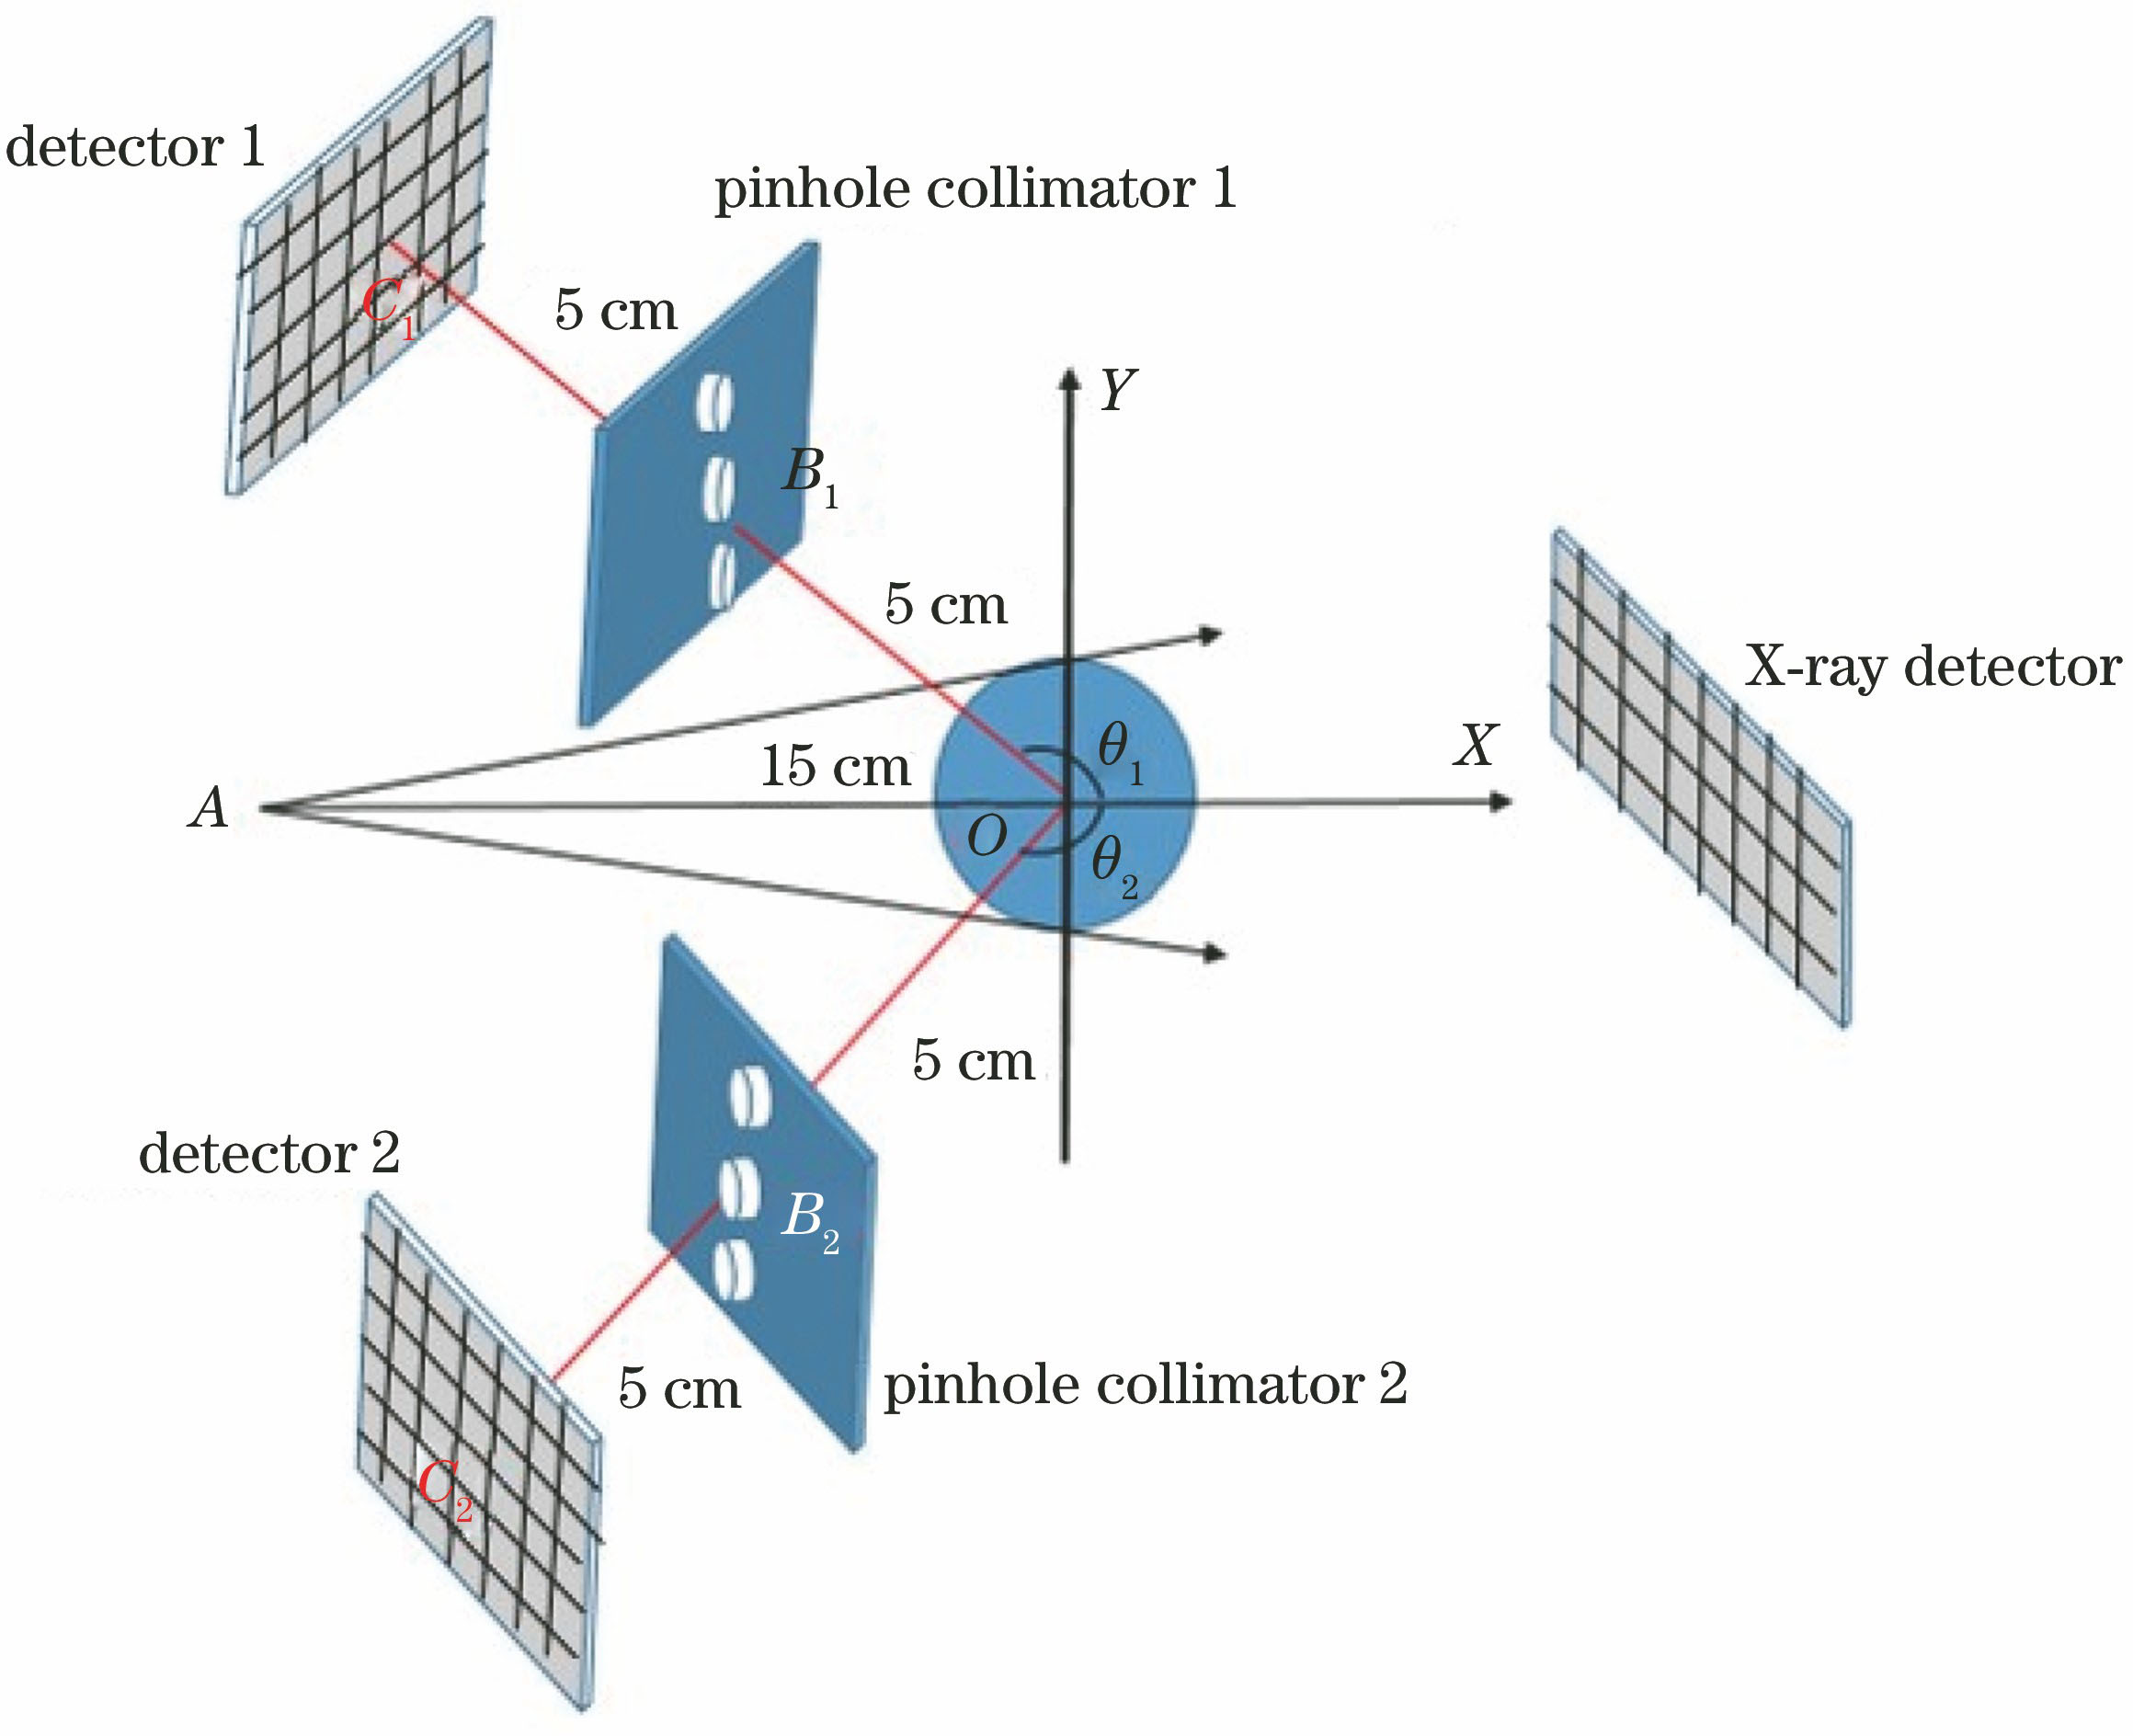
    Fig. 2. Schematic of multi-pinhole XFCT MC model
    Designs of multi-pinhole collimator and phantom. (a) Perpendicular view of lead plate containing three pinholes; (b) cross-section of lead plate containing one pinhole; (c) phantom 1; (d) phantom 2
    Fig. 3. Designs of multi-pinhole collimator and phantom. (a) Perpendicular view of lead plate containing three pinholes; (b) cross-section of lead plate containing one pinhole; (c) phantom 1; (d) phantom 2
    Energy spectrum of X-ray source and spectrum of X-ray fluorescence. (a) Energy spectrum of X-ray source; (b) spectrum of X-ray fluorescence
    Fig. 4. Energy spectrum of X-ray source and spectrum of X-ray fluorescence. (a) Energy spectrum of X-ray source; (b) spectrum of X-ray fluorescence
    Simulation results at different tube voltages. (a) Noise as a function of detection angle at different tube voltages; (b) RSN as a function of tube voltage at different detection angles
    Fig. 5. Simulation results at different tube voltages. (a) Noise as a function of detection angle at different tube voltages; (b) RSN as a function of tube voltage at different detection angles
    Simulation results at different mass fractions of GNPs. (a) Noise as a function of detection angle at different mass fractions of GNPs; (b) RSN as a function of mass fraction of GNPs at different detection angles
    Fig. 6. Simulation results at different mass fractions of GNPs. (a) Noise as a function of detection angle at different mass fractions of GNPs; (b) RSN as a function of mass fraction of GNPs at different detection angles
    Simulation results at different diameters of ROI. (a) Noise as a function of detection angle at different diameters of ROI; (b) RSN as a function of diameter of ROI at different detection angles
    Fig. 7. Simulation results at different diameters of ROI. (a) Noise as a function of detection angle at different diameters of ROI; (b) RSN as a function of diameter of ROI at different detection angles
    RSN at different detection angles. (a) RSN as a function of diameter of ROI at different detection angles; (b) RSN as a function of mass fraction of GNPs at different detection angles
    Fig. 8. RSN at different detection angles. (a) RSN as a function of diameter of ROI at different detection angles; (b) RSN as a function of mass fraction of GNPs at different detection angles
    Reconstructed images. (a) Reconstructed image of phantom 2 at detection angle of 90°; (b) reconstructed image of phantom 2 at detection angle of 120°
    Fig. 9. Reconstructed images. (a) Reconstructed image of phantom 2 at detection angle of 90°; (b) reconstructed image of phantom 2 at detection angle of 120°
    Mean value and RCN of ROI pixel values in reconstructed images. (a) Mean value of ROI pixel values in reconstructed images; (b) RCN at detection angles of 90° and 120°
    Fig. 10. Mean value and RCN of ROI pixel values in reconstructed images. (a) Mean value of ROI pixel values in reconstructed images; (b) RCN at detection angles of 90° and 120°
    ExperimentPhantom 1
    Tube voltage Vsrc /kVGNPs mass fraction ρ /%ROI diameter DROI /mm
    190,100,110,12026
    21200.25,0.50,1,26
    312014,6,8,10
    Table 1. Parameters for phantom 1 in different simulation groups
    ExperimentPhantom 2
    Tube voltage Vsrc /kVGNPs mass fraction ρ /%ROI diameter DROI /mm
    ROI1ROI2ROI3ROI4
    41200.250.500.7513
    Table 2. Parameters for phantom 2
    Jing Guo, Peng Feng, Luzhen Deng, Yan Luo, Peng He, Biao Wei. Optimization of Detection Angle for Pinhole X-Ray Fluorescence Computed Tomography[J]. Acta Optica Sinica, 2020, 40(1): 0111017
    Download Citation