• Laser & Optoelectronics Progress
  • Vol. 57, Issue 19, 190603 (2020)
Peng Ding1、2, Junbin Huang2、*, Yunyun Wang2, Wen Liu2, Hongcan Gu2, and Jinsong Tang1
Author Affiliations
  • 1College of Electronic Engineering, Naval University of Engineering, Wuhan, Hubei 430033, China
  • 2Department of Weapon Engineering, Naval University of Engineering, Wuhan, Hubei 430033, China
  • show less
    DOI: 10.3788/LOP57.190603 Cite this Article Set citation alerts
    Peng Ding, Junbin Huang, Yunyun Wang, Wen Liu, Hongcan Gu, Jinsong Tang. Extraction of Interference Signal of Weak Reflection Fiber Bragg Grating by Wavelet Transform[J]. Laser & Optoelectronics Progress, 2020, 57(19): 190603 Copy Citation Text show less
    Diagram of WFBG sensing system and signal sequence. (a) Diagram of WFBG sensing system; (b) time sequence
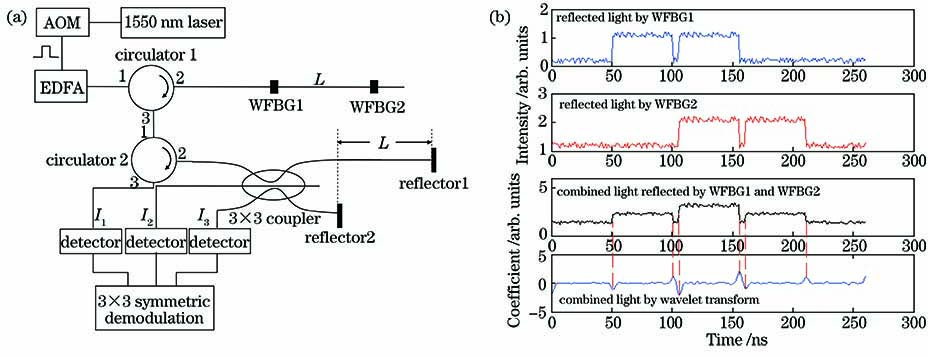
    Fig. 1. Diagram of WFBG sensing system and signal sequence. (a) Diagram of WFBG sensing system; (b) time sequence
    Interference intervals obtained based on AOM modulation signal and CWT for different modulation pulse widths and different numbers of WFBGs. (a) Interference intervals obtained based on AOM modulation signal for 300 ns modulation pulse width and 2-WFBG; (b) interference intervals obtained by CWT for 300 ns modulation pulse width and 2-WFBG; (c) interference intervals obtained by CWT for 450 ns modulation pulse width and 2-WFBG; (d) interference intervals obtained by CWT for 300 ns modulation pul
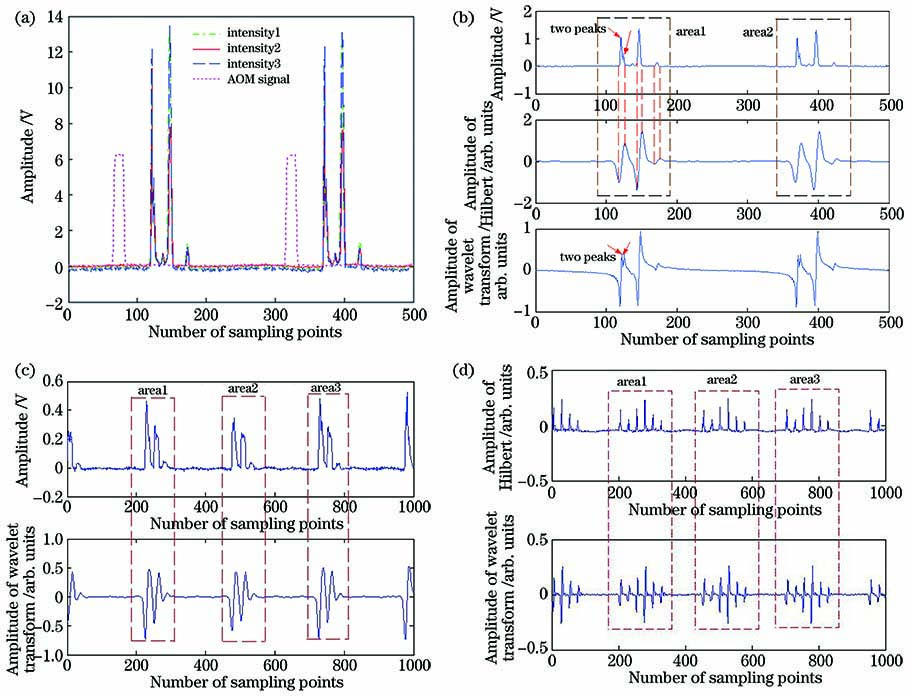
    Fig. 2. Interference intervals obtained based on AOM modulation signal and CWT for different modulation pulse widths and different numbers of WFBGs. (a) Interference intervals obtained based on AOM modulation signal for 300 ns modulation pulse width and 2-WFBG; (b) interference intervals obtained by CWT for 300 ns modulation pulse width and 2-WFBG; (c) interference intervals obtained by CWT for 450 ns modulation pulse width and 2-WFBG; (d) interference intervals obtained by CWT for 300 ns modulation pul
    Vibration signals of vibrating liquid column obtained by multiple measurements and characteristic values of interference intervals for different modulation pulse widths under the same vibration source. (a) 300 ns modulation pulse width; (b) 450 ns modulation pulse width
    Fig. 3. Vibration signals of vibrating liquid column obtained by multiple measurements and characteristic values of interference intervals for different modulation pulse widths under the same vibration source. (a) 300 ns modulation pulse width; (b) 450 ns modulation pulse width
    Measured signals fitted by sine curve. (a) Fitting degree; (b) frequency; (c) amplitude; (d) average fitting degree, RMSE of frequency, and mean square error of amplitude
    Fig. 4. Measured signals fitted by sine curve. (a) Fitting degree; (b) frequency; (c) amplitude; (d) average fitting degree, RMSE of frequency, and mean square error of amplitude
    Light intensity under different modulation pulse widths. (a) 300 ns; (b) 450 ns
    Fig. 5. Light intensity under different modulation pulse widths. (a) 300 ns; (b) 450 ns
    Test times(300 ns,maximum)R-squareAmplitude /radFrequency /HzTest times(300 ns,mean)R-squareAmplitude /radFrequency /Hz
    10.838080.89718473.4910.841890.89543501.94
    20.745025.07631481.3820.850423.75555462.64
    30.701921.07501465.1230.734160.80380511.02
    40.756760.41166527.1540.860820.50245535.79
    50.861250.63180471.8350.888270.76465472.57
    60.855791.45807464.3760.783660.98631491.92
    70.871350.65611538.7170.865370.80427536.52
    80.865340.48561541.9580.901690.60826540.56
    90.549170.56251525.0590.857240.65250473.87
    Test times(450 ns,maximum)R-squareAmplitude /radFrequency /HzTest times(450 ns,mean)R-squareAmplitude /radFrequency /Hz
    10.734961.85052504.4510.789200.95347531.62
    20.818082.19652543.4720.721392.48373523.31
    30.4961410.38246497.6330.8055010.54663459.91
    40.820905.46085445.1840.890362.97201445.53
    50.809650.96564498.3450.852191.08819525.97
    60.606721.46598456.4760.861632.10007466.14
    70.799931.61710533.5470.860960.84263477.35
    80.757140.50143516.8980.872850.56991536.64
    90.689472.05263554.5190.819280.92717499.23
    Table 1. Sine curve fitting data of detected phase signals
    Peng Ding, Junbin Huang, Yunyun Wang, Wen Liu, Hongcan Gu, Jinsong Tang. Extraction of Interference Signal of Weak Reflection Fiber Bragg Grating by Wavelet Transform[J]. Laser & Optoelectronics Progress, 2020, 57(19): 190603
    Download Citation