• Advanced Photonics Nexus
  • Vol. 3, Issue 2, 026006 (2024)
Ziheng Ji1、2, Wentao Yu2、3, Dashan Dong2、4, Hong Yang2、4、5, Kaihui Liu2, Yun-Feng Xiao2、4、5, Qihuang Gong2、4、5, Qinghai Song1、4、*, and Kebin Shi2、4、5、*
Author Affiliations
  • 1Harbin Institute of Technology (Shenzhen), School of Science, Ministry of Industry and Information Technology Key Lab of Micro-Nano Optoelectronic Information System, Shenzhen, China
  • 2Peking University, School of Physics, State Key Laboratory for Mesoscopic Physics and Frontiers Science Center for Nano-Optoelectronics, Beijing, China
  • 3Nanjing University of Science and Technology, Institute of Interdisciplinary Physical Sciences, School of Science, Nanjing, China
  • 4Shanxi University, Collaborative Innovation Center of Extreme Optics, Taiyuan, China
  • 5Peking University Yangtze Delta Institute of Optoelectronics, Nantong, China
  • show less
    DOI: 10.1117/1.APN.3.2.026006 Cite this Article Set citation alerts
    Ziheng Ji, Wentao Yu, Dashan Dong, Hong Yang, Kaihui Liu, Yun-Feng Xiao, Qihuang Gong, Qinghai Song, Kebin Shi. High spatial resolution collinear chiral sum-frequency generation microscopy[J]. Advanced Photonics Nexus, 2024, 3(2): 026006 Copy Citation Text show less
    Schematics of chiral SFG microscope. (a) Conventional noncollinear setup, which uses two separated linear-polarized beams, has sub-optimum NA. (b) Collinear setup, which uses linearly and radially polarized beams, can utilize the full NA with rotational symmetry. The top insets show the cross-sections of the excitation beams and the polarization arrangement at the objective aperture. ESFG,E1 and E2 are the electric fields of the SFG signal and the two incident beams, respectively.
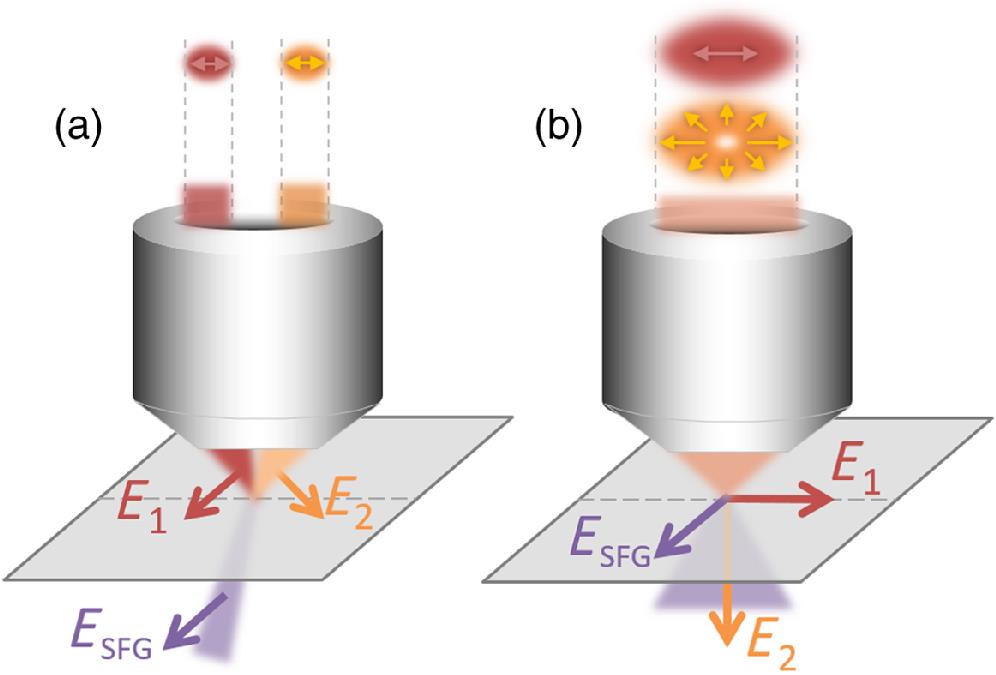
    Fig. 1. Schematics of chiral SFG microscope. (a) Conventional noncollinear setup, which uses two separated linear-polarized beams, has sub-optimum NA. (b) Collinear setup, which uses linearly and radially polarized beams, can utilize the full NA with rotational symmetry. The top insets show the cross-sections of the excitation beams and the polarization arrangement at the objective aperture. ESFG,E1 and E2 are the electric fields of the SFG signal and the two incident beams, respectively.
    Numerical simulation of the foci and the chiral SFG PSF. The first row depicts collinear modality: (a) laser intensity at the objective lens pupil, (b) foci, and (c) chiral SFG PSF. The second row depicts noncollinear modality: (d) laser intensity at the objective lens pupil, (e) foci, and (f) chiral SFG PSF. The colors green, red, and purple are used to represent wavelengths of 520, 820, and 318.2 nm, respectively.
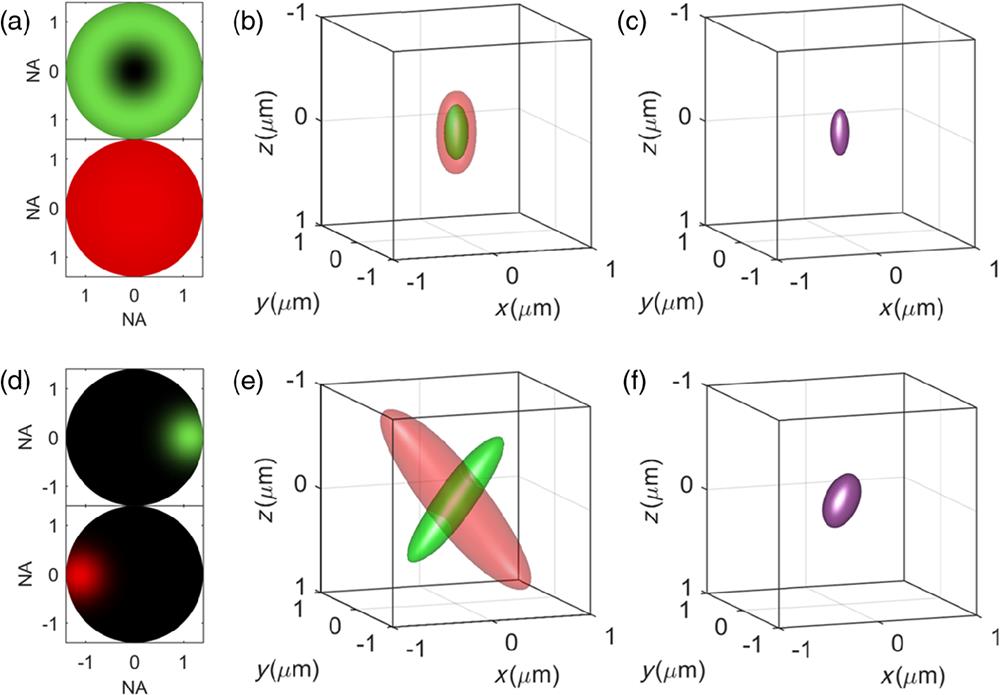
    Fig. 2. Numerical simulation of the foci and the chiral SFG PSF. The first row depicts collinear modality: (a) laser intensity at the objective lens pupil, (b) foci, and (c) chiral SFG PSF. The second row depicts noncollinear modality: (d) laser intensity at the objective lens pupil, (e) foci, and (f) chiral SFG PSF. The colors green, red, and purple are used to represent wavelengths of 520, 820, and 318.2 nm, respectively.
    Dependence of the chiral SFG PSF FWHM on wavelength. The wavelength of visible beam is tuned to scan the SFG wavelength across a typical electronic resonance range.
    Fig. 3. Dependence of the chiral SFG PSF FWHM on wavelength. The wavelength of visible beam is tuned to scan the SFG wavelength across a typical electronic resonance range.
    Dependence of a far-field chiral SFG signal on the sample size. (a) Focusing on the interface between a chiral liquid and an achiral medium. (b) Focusing inside the bulk of a uniform chiral liquid.
    Fig. 4. Dependence of a far-field chiral SFG signal on the sample size. (a) Focusing on the interface between a chiral liquid and an achiral medium. (b) Focusing inside the bulk of a uniform chiral liquid.
    Spectroscopic and imaging demonstration. (a) Experimental light path, where RPC denotes the radial polarization converter, PBS denotes the pellicle beam splitter, and Spec. denotes spectrometer with a liquid-nitrogen-cooled camera. (b) SEM image of the cubic liquid cell, with a scale bar of 5 μm. (c) Spectral profile of the SFG signal from R-BINOL solution and a racemic mixture. (d) Collinear chiral SFG image of the cubic liquid cell.
    Fig. 5. Spectroscopic and imaging demonstration. (a) Experimental light path, where RPC denotes the radial polarization converter, PBS denotes the pellicle beam splitter, and Spec. denotes spectrometer with a liquid-nitrogen-cooled camera. (b) SEM image of the cubic liquid cell, with a scale bar of 5  μm. (c) Spectral profile of the SFG signal from R-BINOL solution and a racemic mixture. (d) Collinear chiral SFG image of the cubic liquid cell.
    Knife-edge measurement of the collinear and noncollinear configuration. The cumulative distribution of the PSF along the x, y, and z directions for collinear (a)–(c) and noncollinear (d)–(f) chiral SFG. The spatial resolutions of collinear chiral SFG along the y and z directions are enhanced by ∼1.4 times, while the spatial resolutions along the x direction are comparable. The error bars represent the standard deviation.
    Fig. 6. Knife-edge measurement of the collinear and noncollinear configuration. The cumulative distribution of the PSF along the x, y, and z directions for collinear (a)–(c) and noncollinear (d)–(f) chiral SFG. The spatial resolutions of collinear chiral SFG along the y and z directions are enhanced by 1.4 times, while the spatial resolutions along the x direction are comparable. The error bars represent the standard deviation.
    Ziheng Ji, Wentao Yu, Dashan Dong, Hong Yang, Kaihui Liu, Yun-Feng Xiao, Qihuang Gong, Qinghai Song, Kebin Shi. High spatial resolution collinear chiral sum-frequency generation microscopy[J]. Advanced Photonics Nexus, 2024, 3(2): 026006
    Download Citation