
Ziheng Ji, Wentao Yu, Dashan Dong, Hong Yang, Kaihui Liu, Yun-Feng Xiao, Qihuang Gong, Qinghai Song, Kebin Shi. High spatial resolution collinear chiral sum-frequency generation microscopy[J]. Advanced Photonics Nexus, 2024, 3(2): 026006
- Advanced Photonics Nexus
- Vol. 3, Issue 2, 026006 (2024)
Abstract
1 Introduction
Chirality refers to a system that is distinguishable from its mirror image.1 This property can influence both molecular interaction and light–matter interactions, which not only has importance in chemistry, biology, and pharmacology, but also leads to a chiral optical response that enables the optical characterization of the chiral system.2 Various techniques have been developed to detect and understand chiral materials. Chiral sum-frequency generation (SFG)3
Despite its continuous successes, the spatial resolution of chiral SFG microscopy is strongly constrained. In principle, chiral SFG is a three-wave mixing process that occurs through the chiral elements of the quadratic susceptibility tensor, .3,4 All participating electric fields must be mutually perpendicular to each other, which makes it necessary to employ noncollinear beam geometry to satisfy this orthogonal polarization restriction.2 However, the noncollinear approach only utilizes partial aperture of the objective lens in an off-axis manner, thereby strongly hindering the spatial resolution. To improve the spatial resolution, it is favorable to align the excitation beams collinearly and cover the full aperture of the objective lens. This is possible for achiral SFG microscopy,15,16 which does not have an orthogonal polarization restriction. In contrast, for chiral SFG, the collinear configuration has only been theoretically proposed by considering the small longitudinal electric field component derived from focused Gaussian beam as excitation,17 but it has not been realized due to the low efficiency of longitudinal polarization conversion. To date, a chiral SFG microscope with diffraction-limited resolution is still absent in experiments. Here we report the first experimental demonstration of high-resolution chiral SFG microscopy that has access to a full numerical aperture (NA).
2 Working Principle
Generally, chiral SFG excitation requires a visible beam with fixed wavelength and an IR beam with tunable wavelength. The induced chiral SFG polarization is perpendicular to both of the excitation electric fields and can be expressed as
Sign up for Advanced Photonics Nexus TOC. Get the latest issue of Advanced Photonics Nexus delivered right to you!Sign up now
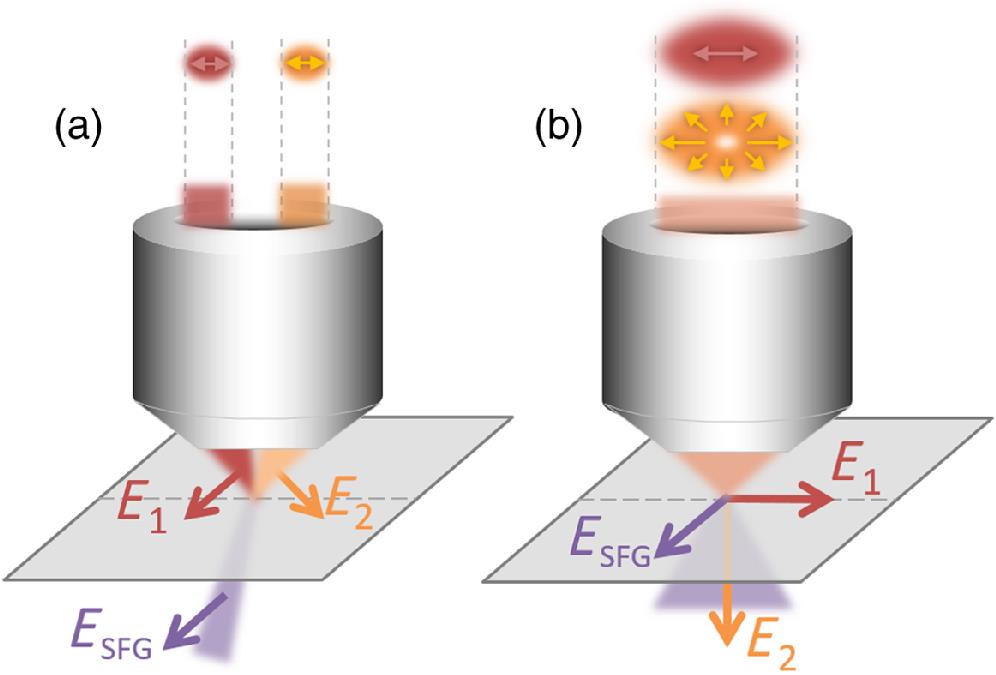
In conventional studies, two incident beams are usually linearly polarized (LP). To produce propagating chiral SFG, the two incident beams must be horizontally separated and focused with a noncollinear configuration [Fig. 1(a)]. In such a case, only a partial NA of the objective lens is utilized, which strongly restricts spatial resolution. Meanwhile, the direction of chiral SFG signals is strongly dependent on the alignment of incident beams, posing additional difficulties in integrating with other optical systems.
![]()
Figure 1.Schematics of chiral SFG microscope. (a) Conventional noncollinear setup, which uses two separated linear-polarized beams, has sub-optimum NA. (b) Collinear setup, which uses linearly and radially polarized beams, can utilize the full NA with rotational symmetry. The top insets show the cross-sections of the excitation beams and the polarization arrangement at the objective aperture.
The above challenge can be tackled with the recently developed structured light, e.g., vectorial beam.18
3 Results and Discussion
3.1 Simulation of Spatial Resolution
To illustrate the advantage of a collinear system, we calculate the three-dimensional intensity distribution of the foci and the chiral SFG point spread function (PSF). The excitations are delivered by focusing two laser beams with wavelengths of 520 and 820 nm using a 1.4 NA objective lens. For the collinear modality [Fig. 2(a)], the foci are two well-overlapped and diffraction-limited spots [Fig. 2(b)], resulting in a tight SFG PSF elongated along the optical axis [Fig. 2(c)]. A direct comparison with the noncollinear modality [Fig. 2(d)] reveals that the foci [Fig. 2(e)] are much larger than the diffraction limit and tilted in different directions, leading to a larger and tilted SFG PSF [Fig. 2(f)]. In potential applications, the visible beam’s wavelength can be tuned to scan the SFG wavelength across an electronic resonance. Figure 3 shows the dependence of the PSF full width at half-maximum (FWHM) on an SFG wavelength. Since the noncollinear PSF is tilted, to ensure a fair comparison, the FWHM of the noncollinear PSF is measured along the major, median, and minor axis of the ellipsoid. The quantitative result shows that the transverse resolution of collinear modality is 1.7 times that of noncollinear modality.
![]()
Figure 2.Numerical simulation of the foci and the chiral SFG PSF. The first row depicts collinear modality: (a) laser intensity at the objective lens pupil, (b) foci, and (c) chiral SFG PSF. The second row depicts noncollinear modality: (d) laser intensity at the objective lens pupil, (e) foci, and (f) chiral SFG PSF. The colors green, red, and purple are used to represent wavelengths of 520, 820, and 318.2 nm, respectively.
![]()
Figure 3.Dependence of the chiral SFG PSF FWHM on wavelength. The wavelength of visible beam is tuned to scan the SFG wavelength across a typical electronic resonance range.
3.2 Simulation of Phase Matching
The collinear configuration offers inherent advantages in phase matching and the efficiency of chiral SFG as well. Using Green’s function formulation,21 which calculates the signal’s dependence on sample size, we evaluated the phase-matching condition of collinear and noncollinear modality. Specifically, a reference sphere is centered at the focus and its diameter D varies from 0.1 to . For each diameter, we calculated the far-field SFG signal distribution generated by the within the sphere, and then integrated the far-field signal within a collection NA of 0.5 (to match the NA of the UV objective lens used in the experiment). We studied the integrated signal as a function of for two scenarios: focusing on the interface between a chiral liquid and an achiral medium [Fig. 4(a)], and focusing inside the bulk of a uniform chiral liquid [Fig. 4(b)]. Figure 4 reveals that the collinear modality produces a higher signal compared to that of the noncollinear modality. Furthermore, as the sample size increases, collinear modality generates accumulating signals when focused on the interface and retains a higher proportion of signals when focused in the bulk. This indicates a better phase-matching condition compared to noncollinear modality, as the signal experiences less destructive interference during generation and propagation. In addition, the faster initial increasing trend is also evidence of a tighter PSF. The energy flux of incident beams is normalized to allow for a fair comparison. At the focal plane, 47.2% of the RP beam energy flux can be converted into the longitudinal polarization component.
![]()
Figure 4.Dependence of a far-field chiral SFG signal on the sample size. (a) Focusing on the interface between a chiral liquid and an achiral medium. (b) Focusing inside the bulk of a uniform chiral liquid.
This approach holds great potential for use in mid-infrared wavelengths for vibrational resonance measurement, despite the challenge posed by the smaller NA of the reflective objective lens. The corresponding results and analysis for the foci, signal PSF, and phase-matching evaluation are presented in the Supplementary Material.
3.3 Experimental Setup
The light path is shown in Fig. 5(a). The Ti:sapphire oscillator (Spectra-Physics, MaiTai) generates 820 nm, 80 MHz, and 80 fs pulses for the IR pump beam. The accompanying optical parametric oscillator (OPO, Spectra-Physics Inspire 100) generates 520 nm pulses for the visible pump beam. Therefore, the wavelength of the chiral SFG signal was 318.2 nm. Note that due to the short wavelength, a special ultraviolet objective with an NA of 0.5 was used to collect the generated SFG signal. Both pump beams were collimated and expanded to a diameter of 10 mm to fully utilize the NA of the excitation objective. The 520 nm beam was converted into an RP beam by a radial polarization converter (ARCoptix) and combined with the -polarized 820 nm beam collinearly using an uncoated pellicle beam splitter (Thorlabs, BP208). An optical delay line in the RP beam path was used to finely adjust the temporal overlapping of the two beams. The combined collinearly propagating beam was directed into a homemade transmission-type microscope with a 1.4 NA focusing objective (Olympus, UPlanSApo 100XO) and a 0.5 NA collecting objective, as mentioned earlier (Thorlabs, LMU-40X-UVB). The generated chiral SFG signal passed through two filters (Thorlabs, FGUV11-UV; Chroma, ET313/25BP) and a polarizer (Thorlabs, GLB10-UV) before being coupled into a spectrometer equipped with a liquid-nitrogen-cooled camera (Princeton Instrument, SP-2500, LN/400BR).
![]()
Figure 5.Spectroscopic and imaging demonstration. (a) Experimental light path, where RPC denotes the radial polarization converter, PBS denotes the pellicle beam splitter, and Spec. denotes spectrometer with a liquid-nitrogen-cooled camera. (b) SEM image of the cubic liquid cell, with a scale bar of
For spectroscopic and imaging demonstration, a 5--long cubic liquid cell was prepared on the surface of a fused silica slide by ion beam lithography, as shown in Fig. 5(b). The cell was filled with a chiral R-BINOL solution, creating a chiral liquid cube in an achiral environment. The generated sum-frequency signal at 318.2 nm coincides with the electronic resonance of the BINOL molecule, which resulted in a significant signal enhancement.22 The two pump beams were collinearly focused into the liquid cell through the microscope, with an average power of 7 mW at 820 nm and 0.5 mW at 520 nm. To reduce the two-photon excitation of fluorescence background from BINOL molecules, a lower-power 520 nm beam was used. Fluorescence above 325 nm will be blocked by the filter.
3.4 Spectroscopic and Imaging Demonstration
By tightly focusing the RP and the -polarized LP beams, the tensor element can be accessed by setting the detection polarizer in the direction in the collinear modality. A typical spectral profile of the chiral SFG signal is shown in Fig. 5(c), where the peak wavelength matches the predicted value of 318.2 nm. Furthermore, when the sample was replaced by a racemic mixture of R-BINOL and S-BINOL solution with the same concentration, no signal was detected. Under the electric dipole approximation, it can be understood that for different enantiomers has opposite signs. Consequently, the induced nonlinear polarizations in the two enantiomers have a phase difference, causing total destructive interference and hence a vanishing signal, as shown in Fig. 5(c). However, higher-order interactions may generate detectable chiral SFG signals, even in racemic mixtures.2 Nevertheless, our spectroscopic measurement indicates that electric-quadrupole or magnetic-dipole contributions are negligible in the observed collinear chiral SFG signal. Therefore, the involvement of a localized longitudinal electric field does not alter the interaction or the selectivity of chiral SFG.
The microscopic imaging capability was demonstrated by raster scanning the sample using a piezo stage. The imaged plane was set at the lower liquid-glass interface, as shown in Fig. 5(b). The resulting image of the liquid cell is presented in Fig. 5(d), which agrees well with the scanning electron microscopy image in Fig. 5(b).
3.5 Resolution Characterization
To quantitatively characterize the spatial resolution, the transverse dimensions of the PSF of both collinear and noncollinear chiral SFG microscopy were measured using a knife-edge method.23 The same chiral liquid cell as shown in Fig. 5(b) was used. For the noncollinear configuration, the two parallel pump beams were symmetrically displaced from the center of the objective lens by 1.6 mm, and both beams were p-polarized to facilitate an SPP polarization arrangement.14 Since chiral SFG only occurs in a chiral liquid, the interface between the chiral liquid and the cell wall can be considered equivalent to a knife edge for the chiral SFG characterizations. The interface was translated transversely across the focus within a range of and at a 50 nm step. The generated chiral SFG intensity was recorded as a function of the interface positions, and the resulting distribution, shown in Fig. 6, represents the cumulative curve of the PSF with respect to the interface traveling distance along either the or direction.
![]()
Figure 6.Knife-edge measurement of the collinear and noncollinear configuration. The cumulative distribution of the PSF along the
To obtain the transverse dimensions of the PSF, numerical calculation based on the knife-edge method was performed to fit the measured results. The intensity distributions used in the fitting were calculated by vectorial diffraction theory. Numerically fitted cumulative curves were obtained by using the least squares method according to experimental results, as plotted in Figs. 6(a), 6(b), 6(d), and 6(e) with the corresponding FWHM of the PSF marked in the figures. Then, the lower interface of the chiral liquid cell was used to characterize the longitudinal PSF for both the collinear and the noncollinear configurations. The lower interface will produce an enhanced signal due to the broken symmetry.12 The measured FWHMs of the longitudinal PSF are displayed in Figs. 6(c) and 6(f). It should be noted that the imaging results were carried out in a region deep inside the chiral liquid cell. The refractive index mismatch between chiral liquid and glass-induced spherical aberration and distortion24 results in a resolution lower than the theoretical limit for both the collinear and noncollinear schemes. Nevertheless, in comparison, the FWHM along the , , and directions is 447, 471, 766 nm for collinear modality and 495, 672, 1124 nm for noncollinear modality, respectively. As shown in Fig. 6, a significant improvement of spatial resolution ( times) on the and directions can be observed.
4 Conclusion
In summary, we have demonstrated a new modality of chiral SFG microscopy. By employing tightly focused vectorial beams in a collinear excitation scheme, we can utilize the full aperture of the microscope, allowing for diffraction-limited spatial resolution. The enhanced resolution is confirmed by knife-edge measurements. Additional simulations demonstrate that this technique offers improved phase-matching conditions and exhibits strong prospects for application in vibrational resonance scenarios. These represent a significant improvement over the conventional noncollinear modality, which is constrained by the polarization restrictions imposed by the chiral nature of the interaction. The proposed technique enables label-free, chiral-selective SFG microscopy with high spatial resolution while also offering ease of integration with existing microscope modalities. This innovative approach has the potential to drive new developments for characterizing and spatially mapping chirality in biological and material systems.
Biographies of the authors are not available.
References
[1] W. T. B. Kelvin. The Molecular Tactics of a Crystal(1894).
[2] Y. R. Shen. Fundamentals of Sum-Frequency Spectroscopy(2016).
[4] J. A. Giordmaine. Nonlinear optical properties of liquids. Phys. Rev., 138, A1599(1965).
[5] N. Ji et al. Toward chiral sum-frequency spectroscopy. J. Am. Chem. Soc., 128, 8845-8848(2006).
[13] K. Zhang et al. Optically active sum frequency generation microscopy for cell imaging, ThC3(2006).
[17] N. I. Koroteev, V. A. Makarov, S. N. Volkov. Sum-frequency generation in the bulk of an isotropic gyrotropic medium with two collinear pump beams. Laser Phys., 9, 655-664(1999).
[18] A. Forbes, M. de Oliveira, M. R. Dennis. Structured light. Nat. Photonics, 15, 253-262(2021).
[20] H. Rubinsztein-Dunlop et al. Roadmap on structured light. J. Opt., 19, 013001(2016).

Set citation alerts for the article
Please enter your email address
© Copyright 2018-2021 | Chinese Laser Press. All Rights Reserved 沪ICP备15018463号-20