• Acta Physica Sinica
  • Vol. 68, Issue 20, 204302-1 (2019)
Ze-Zhong Zhang1、2, Wen-Yu Luo1、2、*, Zhe Pang1、2, and Yi-Qing Zhou1、2
Author Affiliations
  • 1State Key Laboratory of Acoustics, Institute of Acoustics, Chinese Academy of Sciences, Beijing 100190, China
  • 2University of Chinese Academy of Sciences, Beijing 100049, China
  • show less
    DOI: 10.7498/aps.68.20190478 Cite this Article
    Ze-Zhong Zhang, Wen-Yu Luo, Zhe Pang, Yi-Qing Zhou. Modeling of three-dimensional sound propagation through solitary internal waves[J]. Acta Physica Sinica, 2019, 68(20): 204302-1 Copy Citation Text show less
    Stair step approximation of a sloping bottom (red dashed line)水平变化波导(红色虚线)的阶梯近似
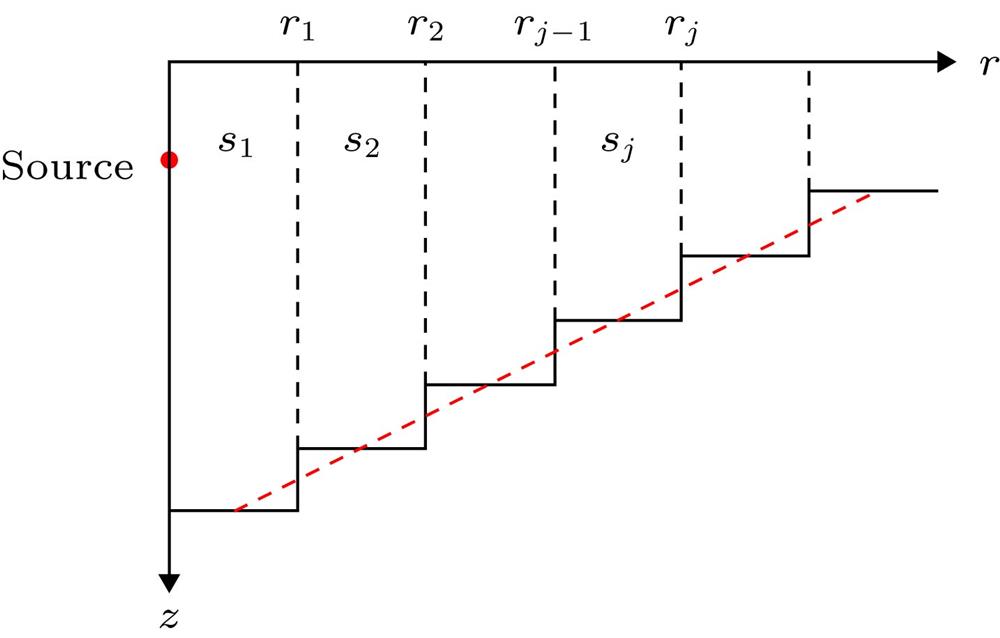
    Fig. 1. Stair step approximation of a sloping bottom (red dashed line)水平变化波导(红色虚线)的阶梯近似
    Complex integration contour for evaluation of the wavenumber integral. The dots indicate horizontal wavenumbers of the normal modes.反傅里叶变换的积分围线(圆圈代表简正波的本征值, 即水平波数)
    Fig. 2. Complex integration contour for evaluation of the wavenumber integral. The dots indicate horizontal wavenumbers of the normal modes.反傅里叶变换的积分围线(圆圈代表简正波的本征值, 即水平波数)
    Sound speed fields considered in this paper: (a) The background sound speed field; (b) in the presence of an internal wave soliton, centered at range 4 km from the source; (c) in the presence of both an internal wave soliton centered at 4 km and a cosine-bell shaped bottom ridge centered at 6 km from the source.二维声速剖面示意图 (a)无孤子内波的声速剖面; (b)孤子内波位于4 km处的声速剖面; (c)孤子内波位于4 km处, 海脊位于6 km处的声速剖面
    Fig. 3. Sound speed fields considered in this paper: (a) The background sound speed field; (b) in the presence of an internal wave soliton, centered at range 4 km from the source; (c) in the presence of both an internal wave soliton centered at 4 km and a cosine-bell shaped bottom ridge centered at 6 km from the source.二维声速剖面示意图 (a)无孤子内波的声速剖面; (b)孤子内波位于4 km处的声速剖面; (c)孤子内波位于4 km处, 海脊位于6 km处的声速剖面
    Transmission loss results for the internal solitary wave problem computed by DGMCM2D and C-SNAP. The blue solid line and red dashed line are the results by DGMCM2D and C-SNAP for the case without internal waves, respectively, and the green and magenta dashed lines are the results by DGMCM2D and C-SNAP for the case with a soliton located at range 4 km, respectively. The black dashed line indicates the center of the soliton.孤子内波环境下DGMCM2D和C-SNAP在70 m深度传播损失曲线 蓝色实线和红色虚线分别表示无孤子内波时DGMCM2D和C-SNAP的计算结果, 绿色和枚红色虚线分别表示孤子内波波包在4 km时DGMCM2D和C-SNAP的计算结果, 黑色虚线表示孤子内波波包位置
    Fig. 4. Transmission loss results for the internal solitary wave problem computed by DGMCM2D and C-SNAP. The blue solid line and red dashed line are the results by DGMCM2D and C-SNAP for the case without internal waves, respectively, and the green and magenta dashed lines are the results by DGMCM2D and C-SNAP for the case with a soliton located at range 4 km, respectively. The black dashed line indicates the center of the soliton.孤子内波环境下DGMCM2D和C-SNAP在70 m深度传播损失曲线 蓝色实线和红色虚线分别表示无孤子内波时DGMCM2D和C-SNAP的计算结果, 绿色和枚红色虚线分别表示孤子内波波包在4 km时DGMCM2D和C-SNAP的计算结果, 黑色虚线表示孤子内波波包位置
    Three-dimensional transmission loss results in the horizontal plane at depth 70 m computed by (a) DGMCM3D and (b) the present 3D model. The center location of the internal wave is indicated by dashed black lines.70 m深度水平面上的三维传播损失结果 (a) DGMCM3D的结果; (b)本文提出的三维模型的结果, 黑色虚线代表孤子内波波包的位置
    Fig. 5. Three-dimensional transmission loss results in the horizontal plane at depth 70 m computed by (a) DGMCM3D and (b) the present 3D model. The center location of the internal wave is indicated by dashed black lines.70 m深度水平面上的三维传播损失结果 (a) DGMCM3D的结果; (b)本文提出的三维模型的结果, 黑色虚线代表孤子内波波包的位置
    Transmission loss lines versus range along the cross-range at depth z= 70 m computed by DGMCM3D (the blue, solid curve) and the present 3D model (the red, dashed curve).纵向距离, 深度z = 70 m, 随距离传播的损失曲线, 蓝色实线和红色虚线分别为DGMCM3D和本文提出的三维模型的结果
    Fig. 6. Transmission loss lines versus range along the cross-range at depth z= 70 m computed by DGMCM3D (the blue, solid curve) and the present 3D model (the red, dashed curve). 纵向距离 , 深度z = 70 m, 随距离传播的损失曲线, 蓝色实线和红色虚线分别为DGMCM3D和本文提出的三维模型的结果
    Geometry of a range-dependent waveguide with a bottom ridge.海底存在海脊的水平变化波导示意图
    Fig. 7. Geometry of a range-dependent waveguide with a bottom ridge.海底存在海脊的水平变化波导示意图
    Two-dimensional transmission loss results at a depth of 70 m for the problem involving a solitary internal wave as well as a bottom ridge by DGMCM2D (the blue, solid curve) and C-SNAP (the red, dashed curve).孤子内波和海脊同时存在时深度70 m处的二维传播损失结果, 其中蓝色实线为DGMCM2D结果, 红色虚线为C-SNAP结果
    Fig. 8. Two-dimensional transmission loss results at a depth of 70 m for the problem involving a solitary internal wave as well as a bottom ridge by DGMCM2D (the blue, solid curve) and C-SNAP (the red, dashed curve).孤子内波和海脊同时存在时深度70 m处的二维传播损失结果, 其中蓝色实线为DGMCM2D结果, 红色虚线为C-SNAP结果
    Three-dimensional transmission loss results in the horizontal plane at depth of 70 m in the presence of a solitary internal wave as well as a bottom ridge computed by (a) DGMCM3D and (b) the present 3D model. The center locations of the internal wave and the ridge are indicated by dashed black and red lines, respectively.同时存在孤子内波和海脊时深度70 m水平平面上的三维传播损失 (a) DGMCM3D结果; (b)本文提出的三维模型的结果. 黑色和红色虚线分别表示孤子内波波包和海脊中心的位置
    Fig. 9. Three-dimensional transmission loss results in the horizontal plane at depth of 70 m in the presence of a solitary internal wave as well as a bottom ridge computed by (a) DGMCM3D and (b) the present 3D model. The center locations of the internal wave and the ridge are indicated by dashed black and red lines, respectively.同时存在孤子内波和海脊时深度70 m水平平面上的三维传播损失 (a) DGMCM3D结果; (b)本文提出的三维模型的结果. 黑色和红色虚线分别表示孤子内波波包和海脊中心的位置
    Ze-Zhong Zhang, Wen-Yu Luo, Zhe Pang, Yi-Qing Zhou. Modeling of three-dimensional sound propagation through solitary internal waves[J]. Acta Physica Sinica, 2019, 68(20): 204302-1
    Download Citation