
Jun Yan, Nan Ye, Tingcheng Li, Hongyu Zhu. Research and Implementation of Industrial Photogrammetry Without Coded Points[J]. Acta Optica Sinica, 2019, 39(10): 1015002
- Acta Optica Sinica
- Vol. 39, Issue 10, 1015002 (2019)
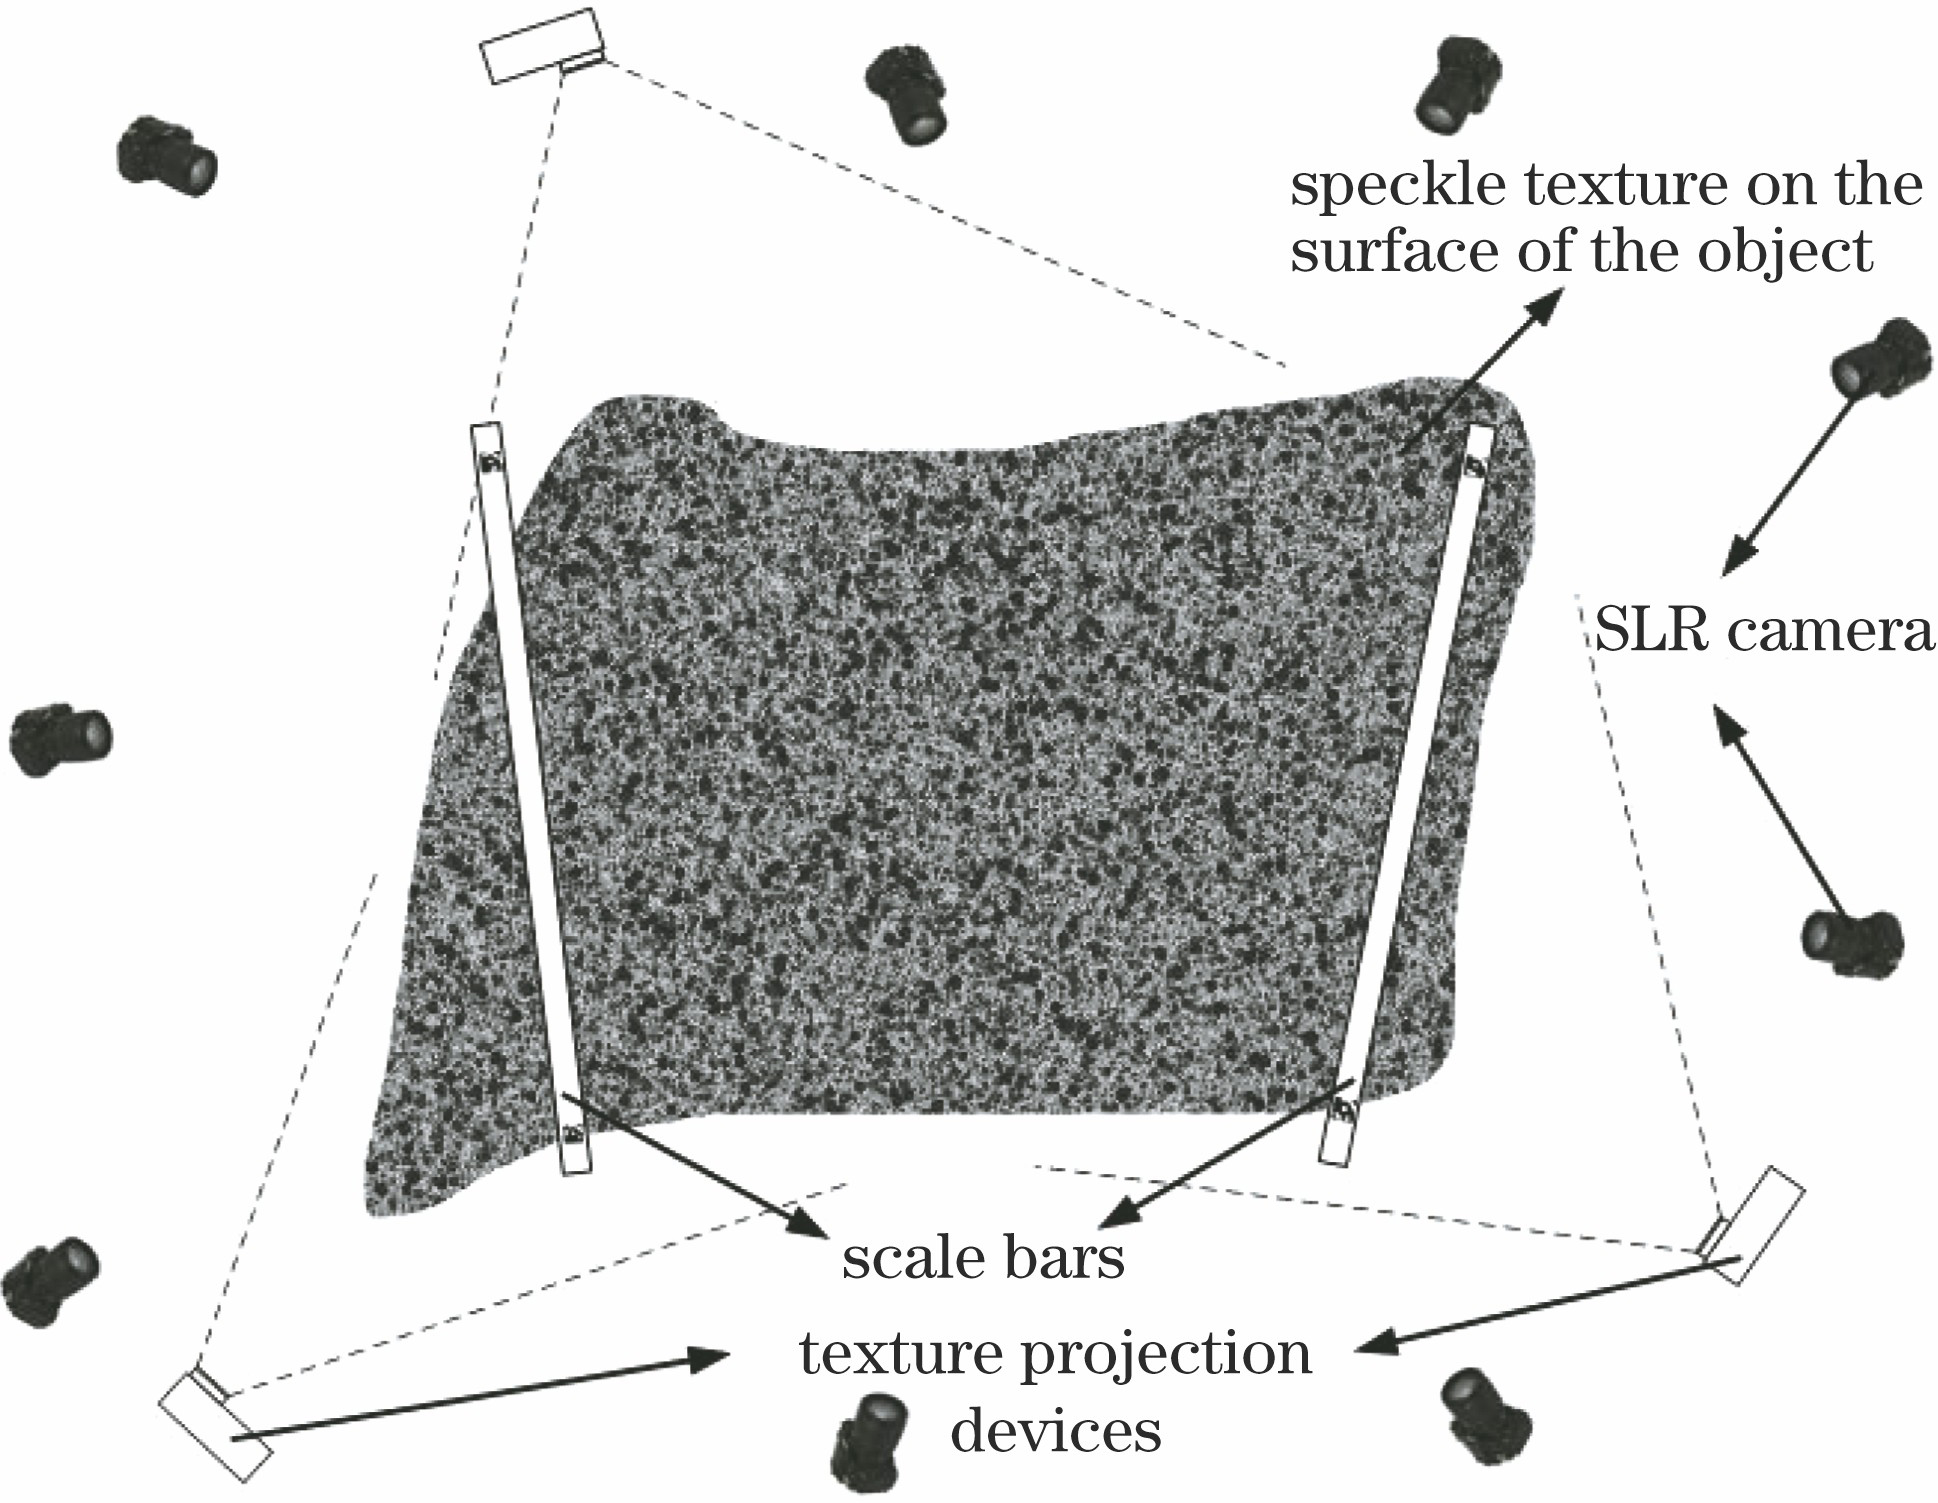
Fig. 1. Schematic of photogrammetry without coded points
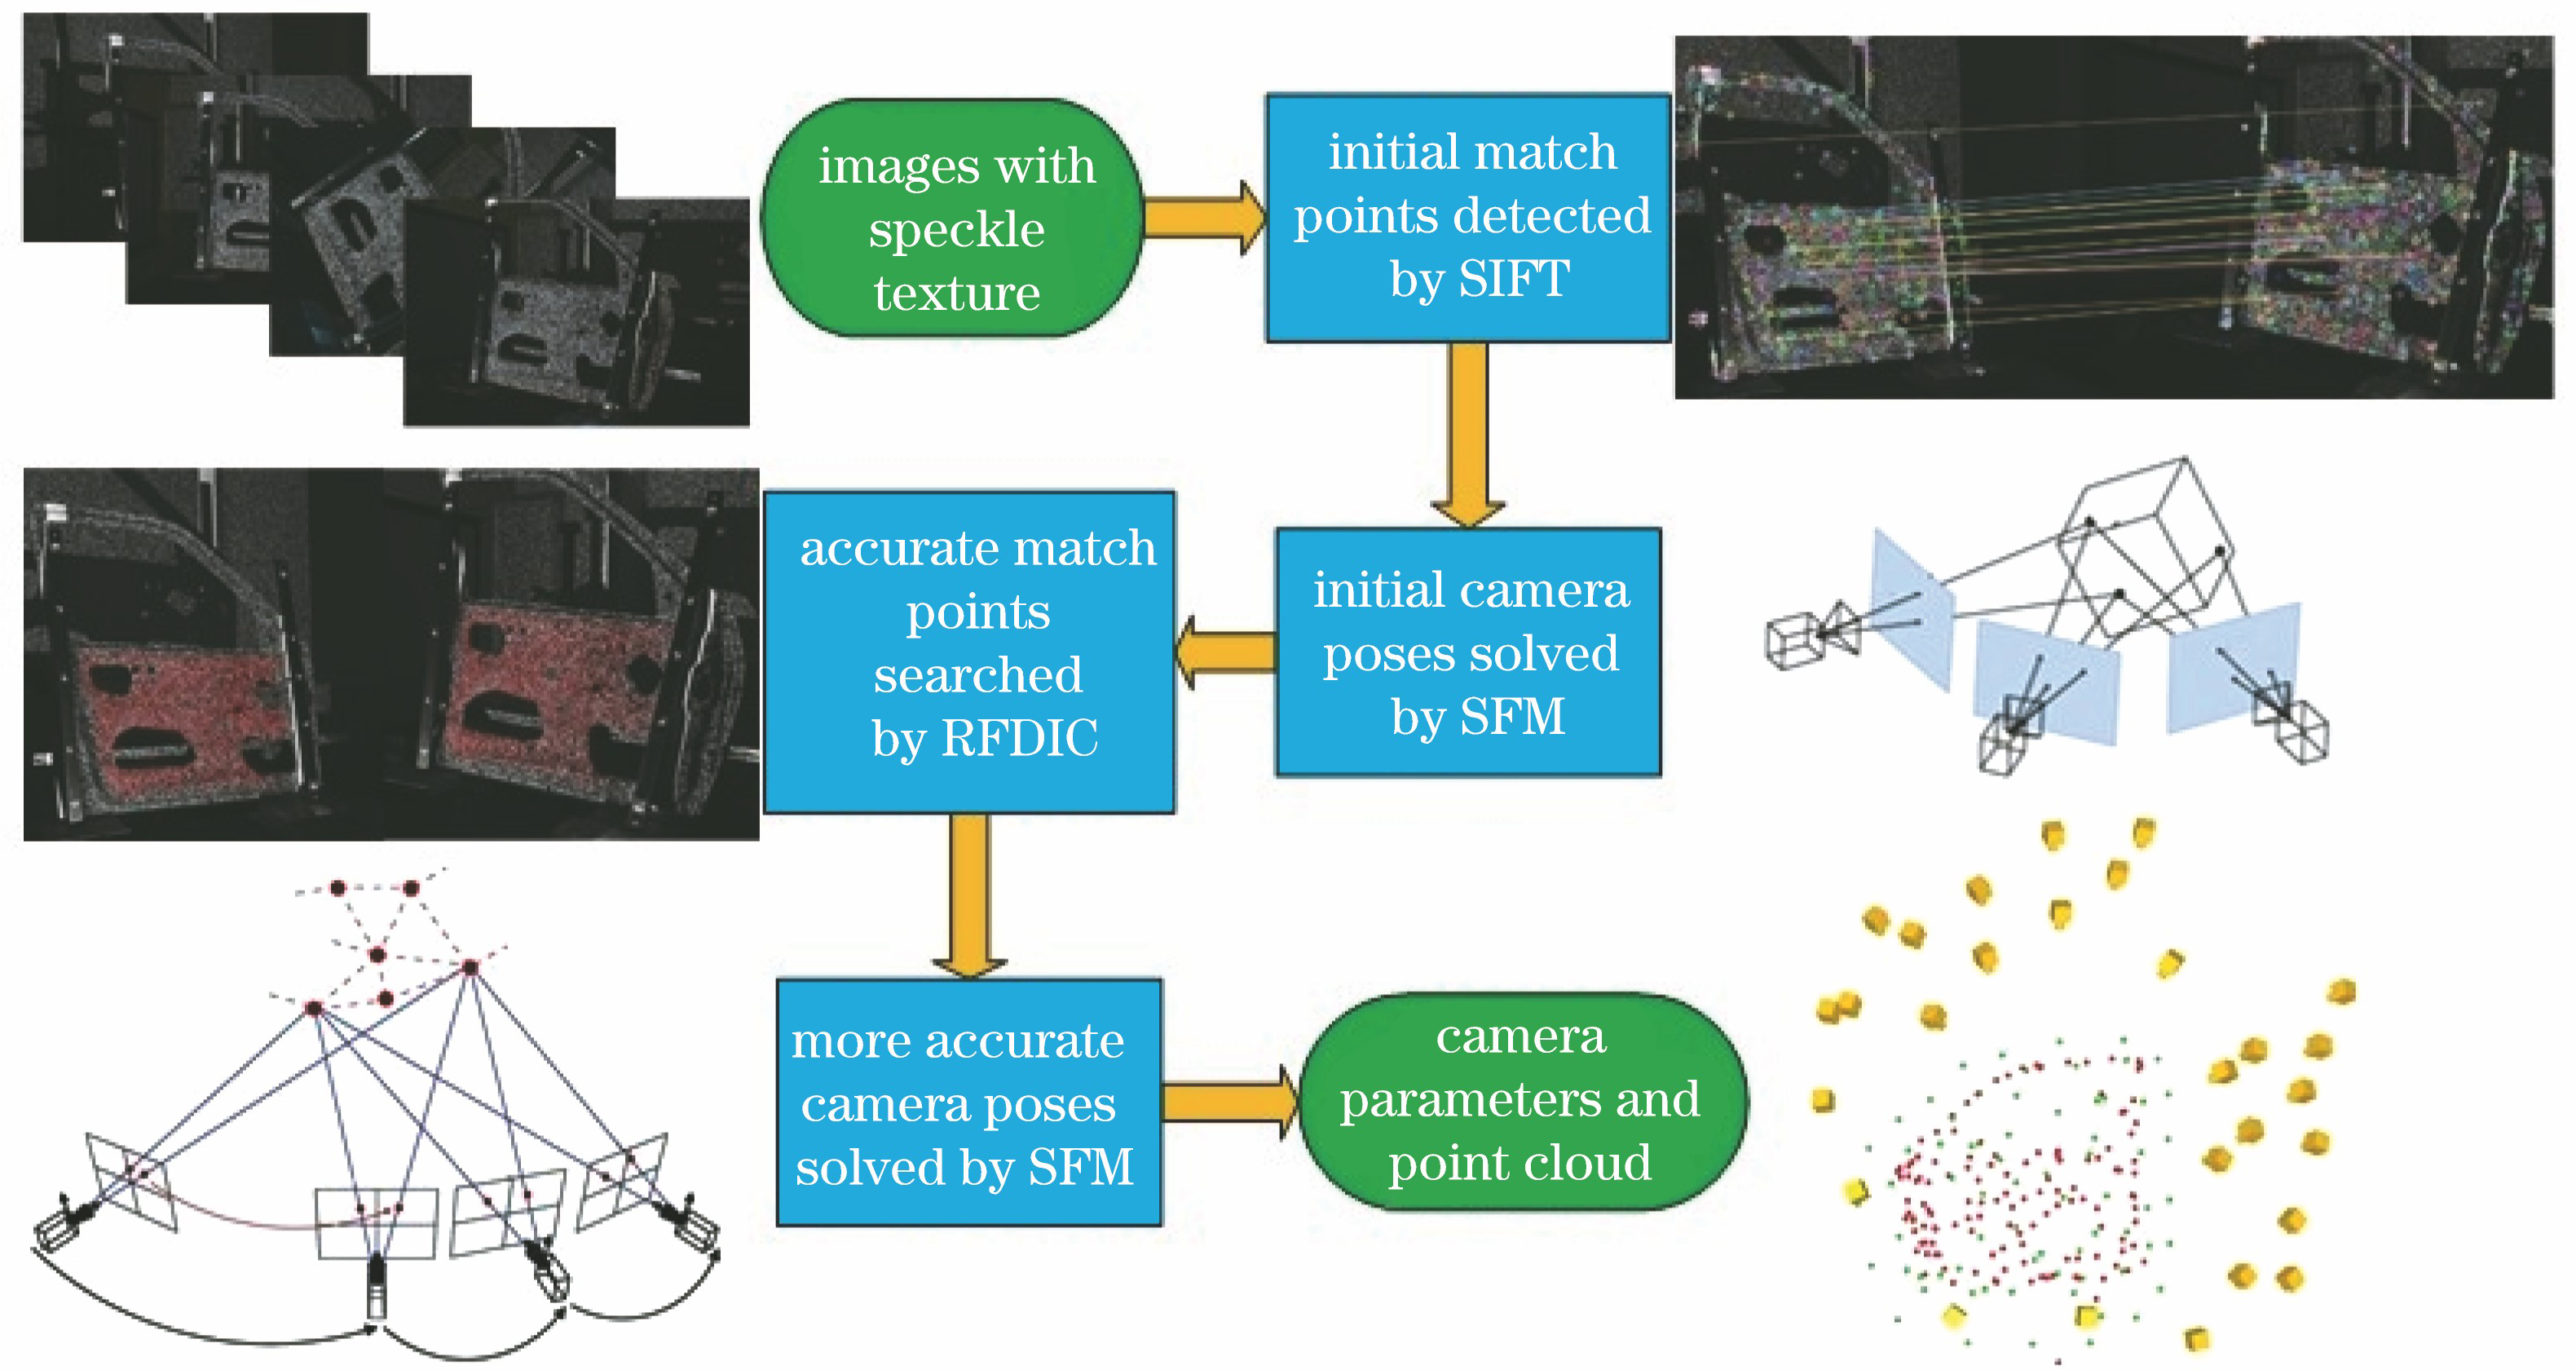
Fig. 2. Process of multi-view structure reconstruction without coded points
Fig. 3. White basecoat of digital speckle pattern
Fig. 4. Pseudocode of random growth method of speckle particle
Fig. 5. Speckle particles with random shapes
Fig. 6. Speckle patterns with different sizes of speckle particles. (a) 5-8 pixel; (b) 9-12 pixel; (c) 13-20 pixel
Fig. 7. Speckle patterns with different proportions of speckle particles. (a) 20%; (b) 40%; (c) 60%
Fig. 8. Speckle patterns with different grayscale ranges (0-255) of speckle particles. (a) 40-100; (b) 20-80; (c) 0-60
Fig. 9. DIC matching results of projected speckles. (a) Left image; (b) right image
Fig. 10. Mismatching problem of DIC between images with large rotation angle. (a) Left image; (b) right image
Fig. 11. Matching strategy of RFDIC
Fig. 12. Matching results of RFDIC and Patch Matching methods. (a) Reference image; (b) RFDIC method; (c) Patch Matching method
Fig. 13. Pseudocode of multi-view geometry reconstruction without coded points
Fig. 14. Sheet metal of aircraft skin
Fig. 15. Experimental scene of photogrammetry without coded points
Fig. 16. Multi-view structure reconstructed by photogrammetry without coded points
Fig. 17. Point cloud and triangular mesh model reconstructed from two views
Fig. 18. Comparison of overall deviation of point cloud
|
Table 1. Comparison of matching results between RFDIC and Patch Matching methods
| ||||||||||
Table 2. Comparison of running time and point cloud error between RFDIC and Patch Matching methods
|
Table 3. Reprojection mean error and RMSE of multi-view structure
|
Table 4. Reconstruction results and error comparison of scale bars’ length
|
Table 5. Comparison of point cloud deviations reconstructed from two views


Set citation alerts for the article
Please enter your email address

© Copyright 2018-2021 | Chinese Laser Press. All Rights Reserved 沪ICP备15018463号-20