
Tingting Zeng, Jianping Ding. Three-dimensional multiple optical cages formed by focusing double-ring shaped radially and azimuthally polarized beams[J]. Chinese Optics Letters, 2018, 16(3): 031405
- Chinese Optics Letters
- Vol. 16, Issue 3, 031405 (2018)
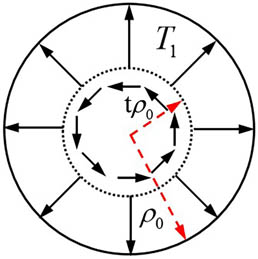
Fig. 1. Polarization state of the double-mode vector beam.
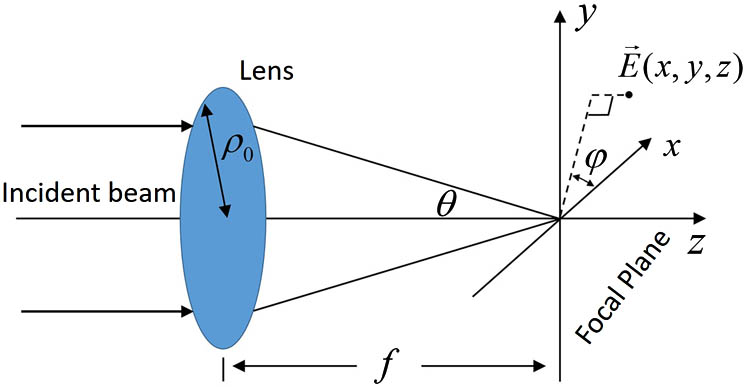
Fig. 2. Schematic of the focusing system.
Fig. 3. Calculated intensity distributions of in the x z β 0 = 1.12 z d = 3 λ t = 0.6 | E r | 2 + | E φ | 2 | E z | 2 z x
Fig. 4. Calculated intensity distributions with different parameters in the x z z d = 3 λ β 0 = 1.12 t = 0.3 t = 0.8 z d = 3 λ t = 0.6 β 0 = 1.6 β 0 = 0.7 t = 0.55 β 0 = 1.5 z d = λ z d = 5 λ
Fig. 5. Intensity distributions of multiple 3D optical cages generated in the focal volume. Left column: five cages in each of two transverse planes located, respectively, at z = + 15 λ z = − 15 λ z = + 15 λ x = + 15.6 λ x = − 15.6 λ 2 × 1 z = 45 λ 15 λ − 15 λ − 45 λ z = + 15 λ y = 0 x = + 13.8 λ

Set citation alerts for the article
Please enter your email address
© Copyright 2018-2021 | Chinese Laser Press. All Rights Reserved 沪ICP备15018463号-20