• Acta Optica Sinica
  • Vol. 40, Issue 3, 0301001 (2020)
Ying Chen1, Deyong Sun1、2、3、*, Hailong Zhang1、2、3, Shengqiang Wang1、2、3, Zhongfeng Qiu1、2、3, and Yijun He1、2、3
Author Affiliations
  • 1School of Marine Sciences, Nanjing University of Information Science and Technology, Nangjing, Jiangsu 210044, China
  • 2Jiangsu Key Laboratory of Ocean Dynamics Remote Sensing and Acoustics, Nangjing, Jiangsu 210044, China
  • 3Jiangsu Research Center for Ocean Survey Technology, Nangjing, Jiangsu 210044, China
  • show less
    DOI: 10.3788/AOS202040.0301001 Cite this Article Set citation alerts
    Ying Chen, Deyong Sun, Hailong Zhang, Shengqiang Wang, Zhongfeng Qiu, Yijun He. Remote-Sensing Monitoring of Green Tide and Its Drifting Trajectories in Yellow Sea Based on Observation Data of Geostationary Ocean Color Imager[J]. Acta Optica Sinica, 2020, 40(3): 0301001 Copy Citation Text show less
    Distribution of Ulva prolifera in Yellow Sea area. (a) Location of Yellow Sea, where RGB image shows pseudo-color composite image of GOCI acquired on 26 May, 2017; (b) true-color composite image of GOCI along coast of Qingdao acquired on 26 May, 2017; (c) aerial photo of Qingdao coast attacked by Ulva prolifera taken on 10 July, 2016
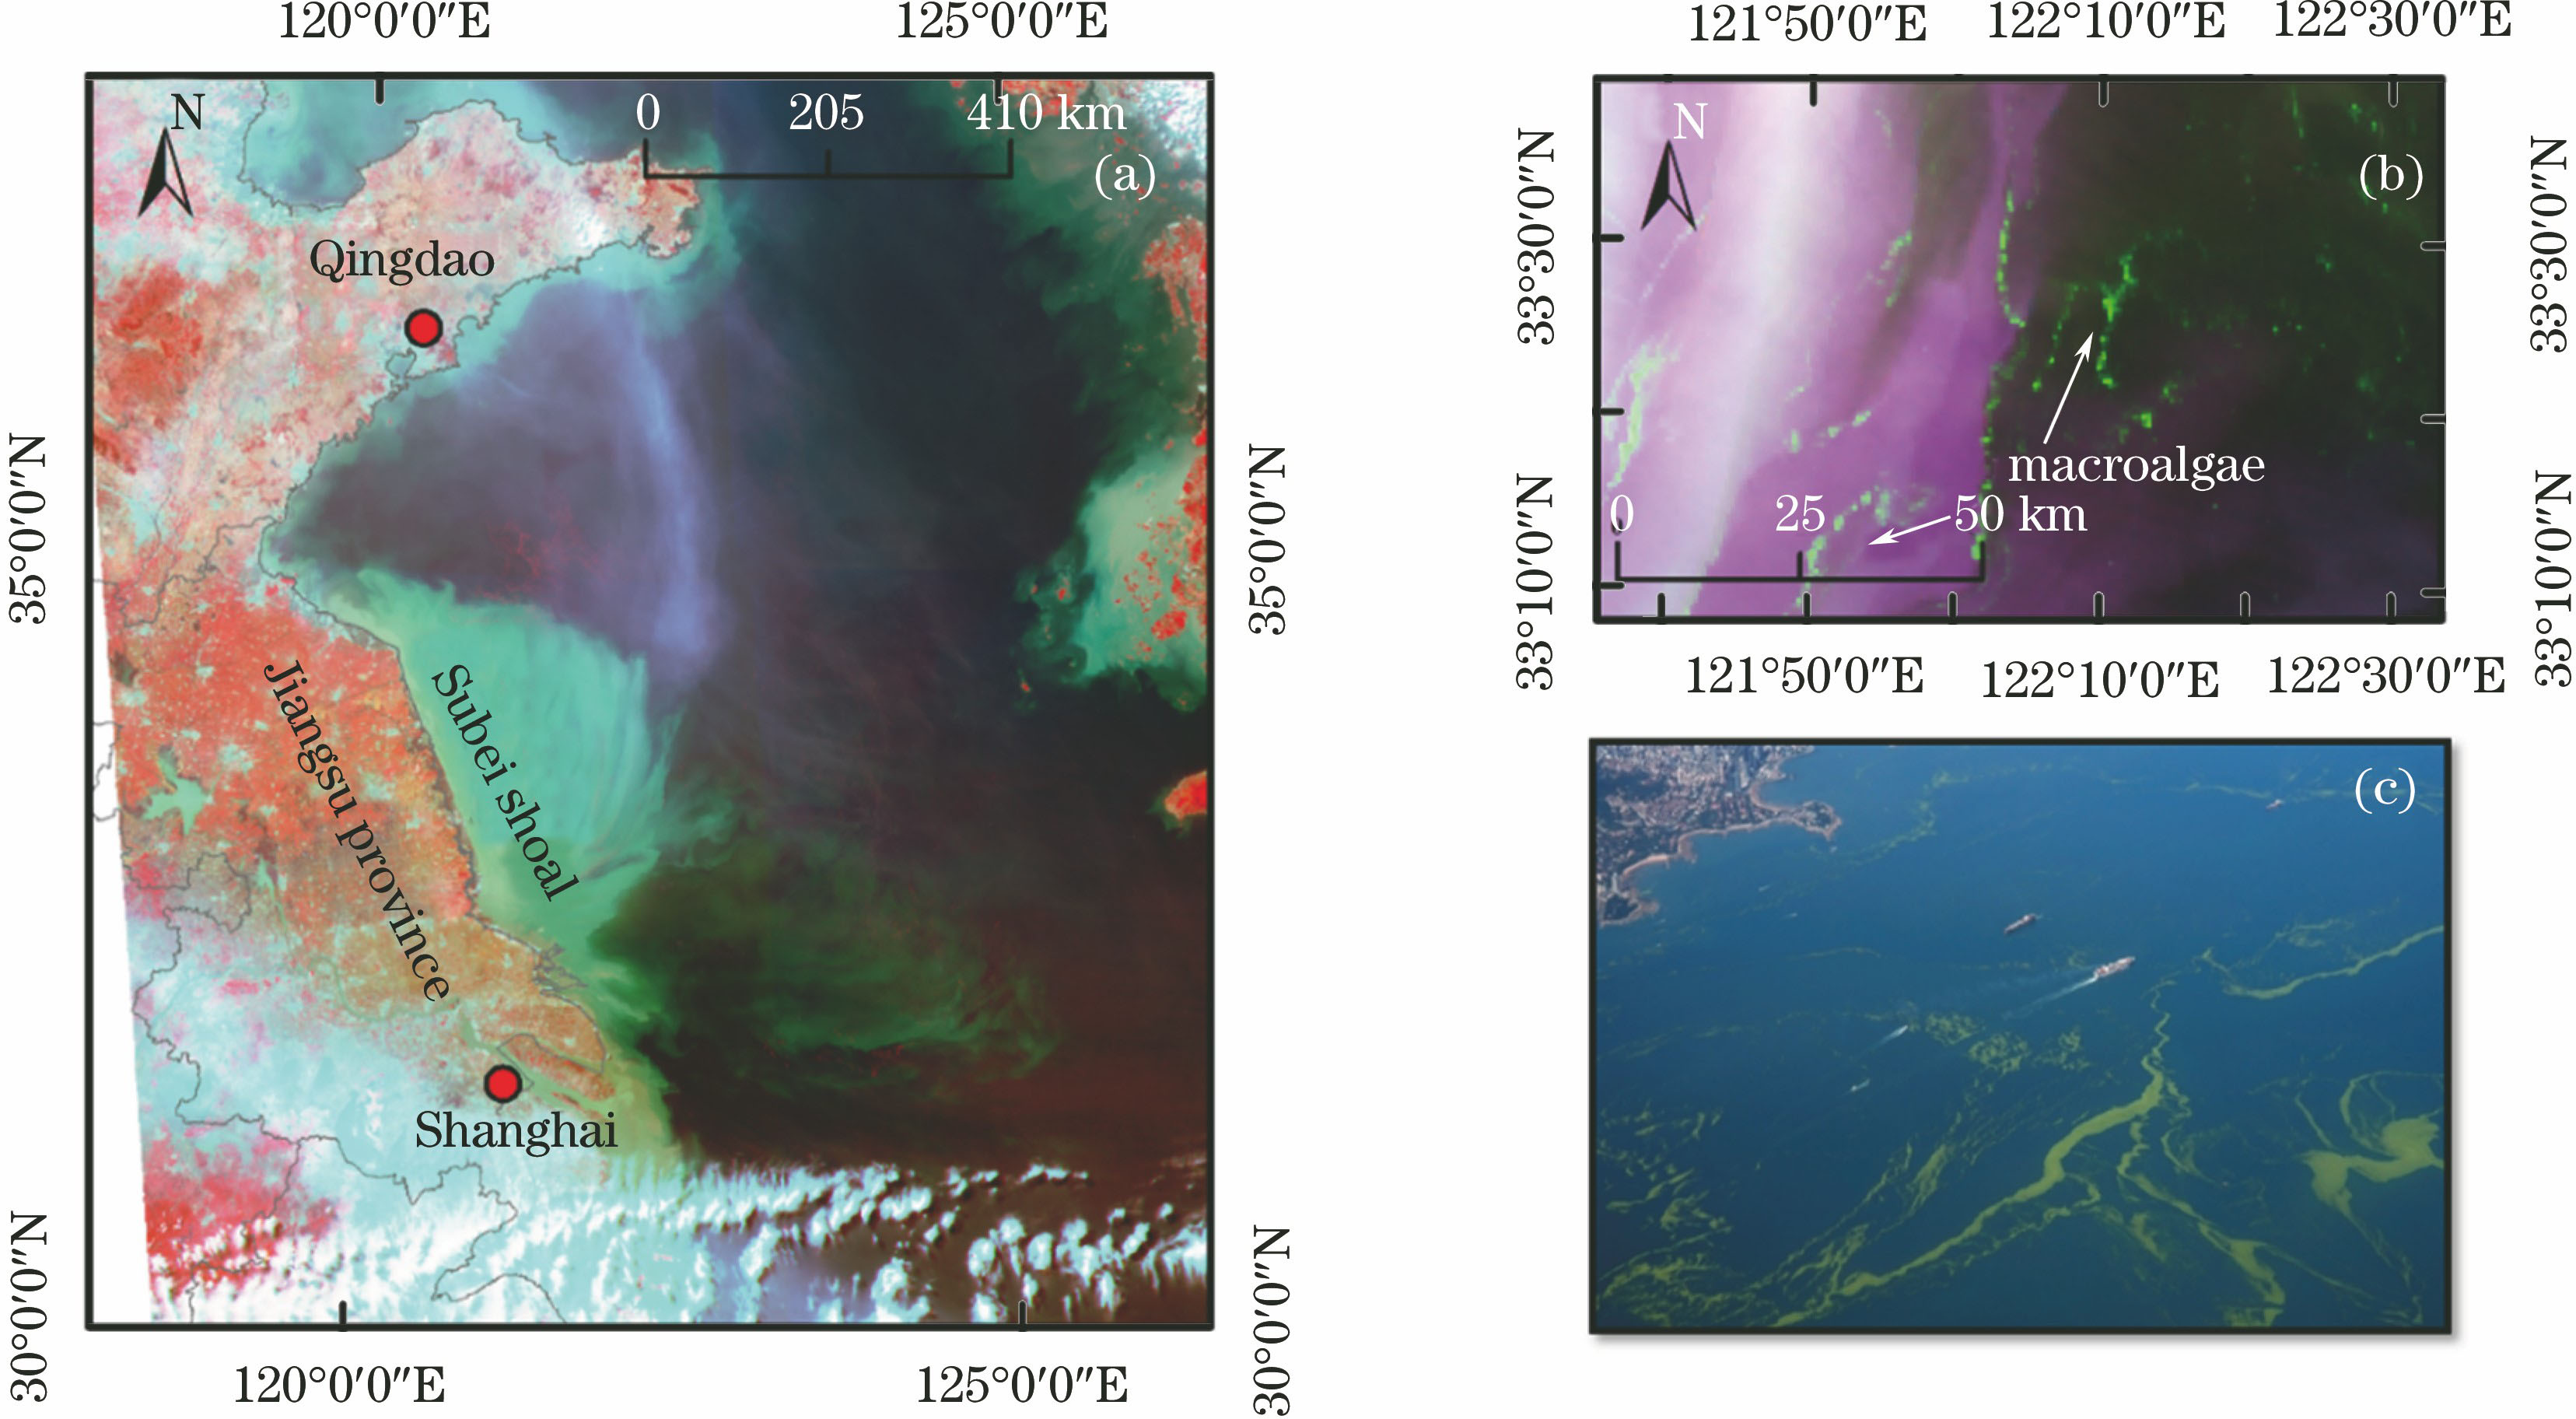
    Fig. 1. Distribution of Ulva prolifera in Yellow Sea area. (a) Location of Yellow Sea, where RGB image shows pseudo-color composite image of GOCI acquired on 26 May, 2017; (b) true-color composite image of GOCI along coast of Qingdao acquired on 26 May, 2017; (c) aerial photo of Qingdao coast attacked by Ulva prolifera taken on 10 July, 2016
    Mean value (solid line) and standard deviation (shadow) of Rayleigh-corrected reflectance spectra of macroalgae, seawater, terrestrial vegetation, and cloud pixels
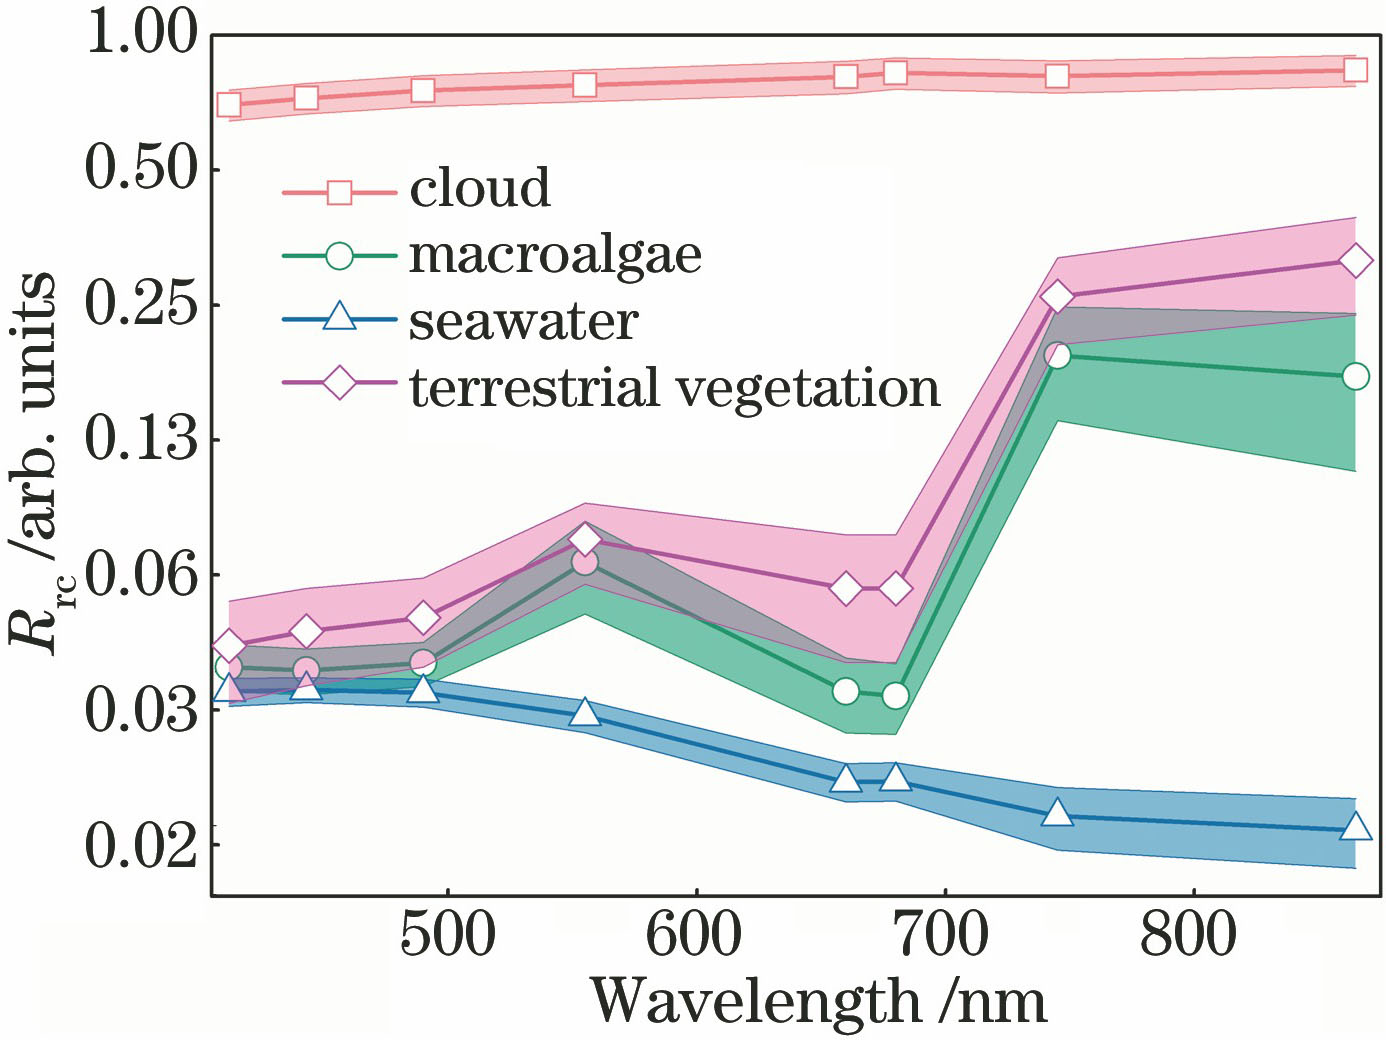
    Fig. 2. Mean value (solid line) and standard deviation (shadow) of Rayleigh-corrected reflectance spectra of macroalgae, seawater, terrestrial vegetation, and cloud pixels
    Characteristic curves of K-T transformation components of floating macroalgae and seawater at three different periods (error lines represent standard deviation of mean values). (a) 19 May, 2017; (b) 16 June, 2017; (c) 13 July, 2017; (d) three different periods
    Fig. 3. Characteristic curves of K-T transformation components of floating macroalgae and seawater at three different periods (error lines represent standard deviation of mean values). (a) 19 May, 2017; (b) 16 June, 2017; (c) 13 July, 2017; (d) three different periods
    Probability and cumulative probability distributions of TCT-GTI values for different target object pixels. (a) Seawater pixels (N=12634); (b) Ulva prolifera pixels (N=7570); (c) mean values and standard deviation of TCT-GTI values for all Ulva prolifera and seawater pixels
    Fig. 4. Probability and cumulative probability distributions of TCT-GTI values for different target object pixels. (a) Seawater pixels (N=12634); (b) Ulva prolifera pixels (N=7570); (c) mean values and standard deviation of TCT-GTI values for all Ulva prolifera and seawater pixels
    Probability and cumulative probability distributions of brightness values for different target object pixels. (a) Ulva prolifera (N=15078); (b) seawater (N=12633); (c) thick cloud (N=181624); (d) mean values and standard deviation of brightness values for all Ulva prolifera, seawater, and thick cloud pixels
    Fig. 5. Probability and cumulative probability distributions of brightness values for different target object pixels. (a) Ulva prolifera (N=15078); (b) seawater (N=12633); (c) thick cloud (N=181624); (d) mean values and standard deviation of brightness values for all Ulva prolifera, seawater, and thick cloud pixels
    Confusion matrix and all indexes of accuracy evaluation
    Fig. 6. Confusion matrix and all indexes of accuracy evaluation
    Comparison of results of green-tide extraction using three different algorithms. (a) (e) (i) Pseudo-color images for different regions; (b)-(d) results of green-tide extraction using TCT-GTI algorithm; (f)-(h) results of green-tide extraction using AFAI algorithm; (j)-(l) results of green-tide extraction using IGAG algorithm
    Fig. 7. Comparison of results of green-tide extraction using three different algorithms. (a) (e) (i) Pseudo-color images for different regions; (b)-(d) results of green-tide extraction using TCT-GTI algorithm; (f)-(h) results of green-tide extraction using AFAI algorithm; (j)-(l) results of green-tide extraction using IGAG algorithm
    Accuracy evaluation values of TCT-GTI, AFAI, and IGAG algorithms
    Fig. 8. Accuracy evaluation values of TCT-GTI, AFAI, and IGAG algorithms
    Coverage area of Ulva prolifera as a function of time
    Fig. 9. Coverage area of Ulva prolifera as a function of time
    Monitoring results of green tide of GOCI images at different time and its drifting trajectory. (a) Distribution of Ulva prolifera on 13 May, 2017; (b) distribution of Ulva prolifera on 21 May, 2017; (c) distribution of Ulva prolifera on 4 June, 2017; (d) distribution of Ulva prolifera on 7 June, 2017; (e) distribution of Ulva prolifera on 26 June, 2017; (f) distribution of Ulva prolifera on 27 June, 2017; (g) distribution of Ulva prolifera on 1 Ju
    Fig. 10. Monitoring results of green tide of GOCI images at different time and its drifting trajectory. (a) Distribution of Ulva prolifera on 13 May, 2017; (b) distribution of Ulva prolifera on 21 May, 2017; (c) distribution of Ulva prolifera on 4 June, 2017; (d) distribution of Ulva prolifera on 7 June, 2017; (e) distribution of Ulva prolifera on 26 June, 2017; (f) distribution of Ulva prolifera on 27 June, 2017; (g) distribution of Ulva prolifera on 1 Ju
    Average wind-field distributions for corresponding dates of green-tide remote sensing monitoring. (a) May 13-21,2017; (b) May 21-June 4,2017; (c) June 4-7, 2017; (d) June 6-26, 2017; (e) June 26-27, 2017; (f) June 27-July 1, 2017
    Fig. 11. Average wind-field distributions for corresponding dates of green-tide remote sensing monitoring. (a) May 13-21,2017; (b) May 21-June 4,2017; (c) June 4-7, 2017; (d) June 6-26, 2017; (e) June 26-27, 2017; (f) June 27-July 1, 2017
    BandBand center /nmBandwidth /nmSNR(signal to noise ratio)TypePrimary use
    1412201000VisibleYellow substance turbidity
    2443201190VisibleChlorophyll absorption maximum
    3490201170VisibleChlorophyll and other pigments
    4555201070VisibleTurbidity, suspended sediment
    5660201010VisibleBaseline of fluorescence signal,chlorophyll, suspended sediment
    668010870VisibleAtmospheric correctionand fluorescence signal
    774520860NIRAtmospheric correction andbaseline of fluorescence
    886540750NIRAerosol optical thickness, vegetation,water vapor reference over the ocean
    Table 1. Band characteristics of GOCI sensor and its main applications
    RegionTCT-GTIAFAIIGAG
    Pixel No.Aa /km2Pixel No.Aa /km2Pixel No.Aa / km2
    Total area226275656.75229125728.00235652.00
    Region 1911227.75877219.25962240.50
    Region 212531.2510225.509624.00
    Table 2. Comparison of macroalgae coverage areas for three algorithms
    Ying Chen, Deyong Sun, Hailong Zhang, Shengqiang Wang, Zhongfeng Qiu, Yijun He. Remote-Sensing Monitoring of Green Tide and Its Drifting Trajectories in Yellow Sea Based on Observation Data of Geostationary Ocean Color Imager[J]. Acta Optica Sinica, 2020, 40(3): 0301001
    Download Citation