
Bo Song, Wenyu Cui, Lili Du, Chuanjie Zhou, Weining Yi. High-resolution satellite ocean background imaging simulation method[J]. Infrared and Laser Engineering, 2021, 50(9): 20200514
- Infrared and Laser Engineering
- Vol. 50, Issue 9, 20200514 (2021)
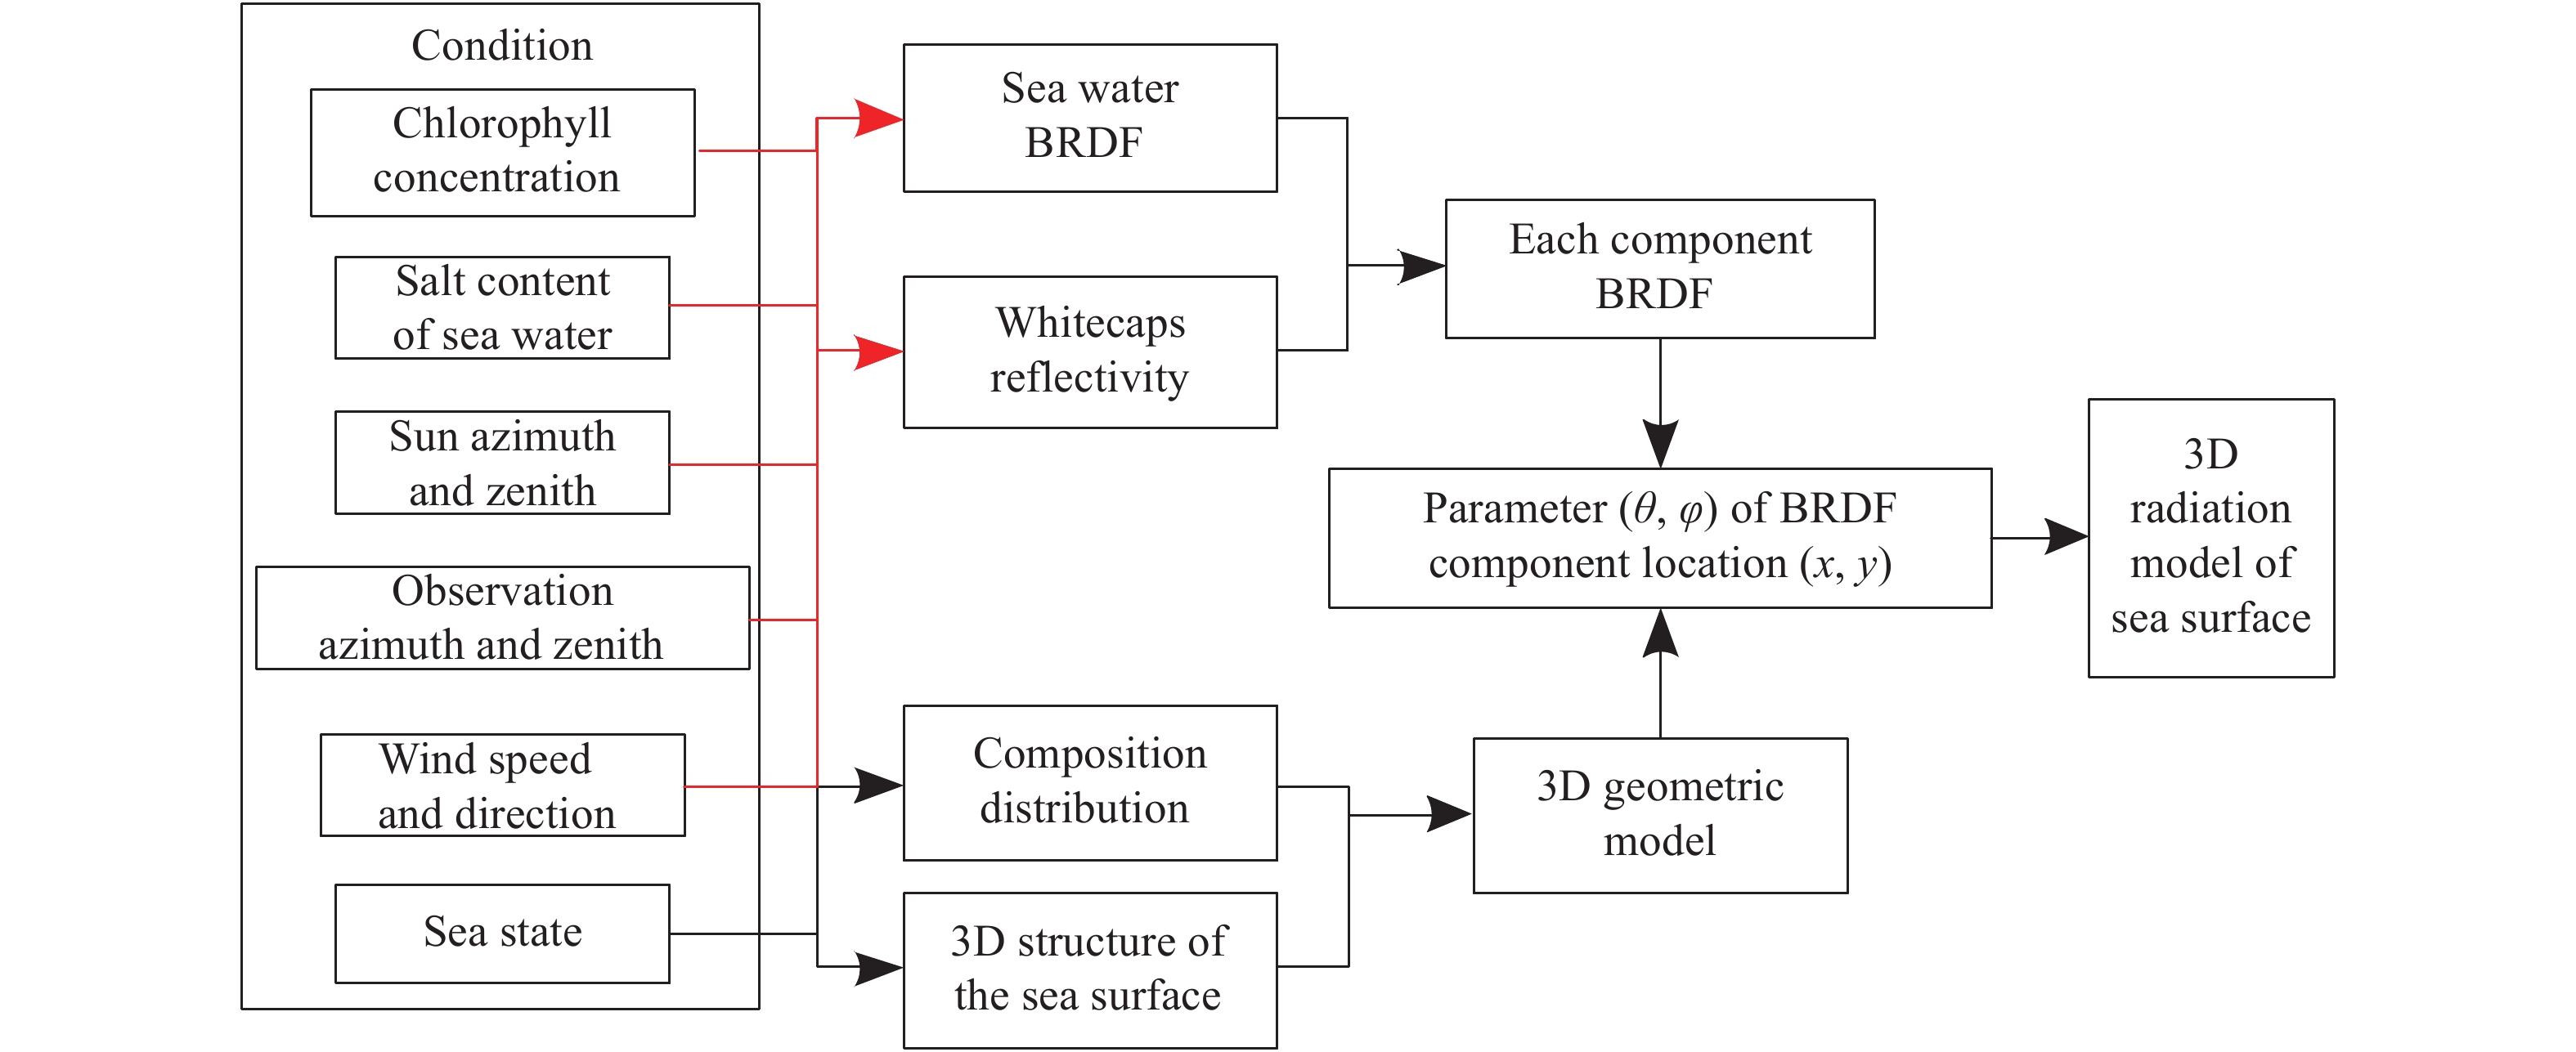
Fig. 1. 3D radiation model structure diagram of the sea surface
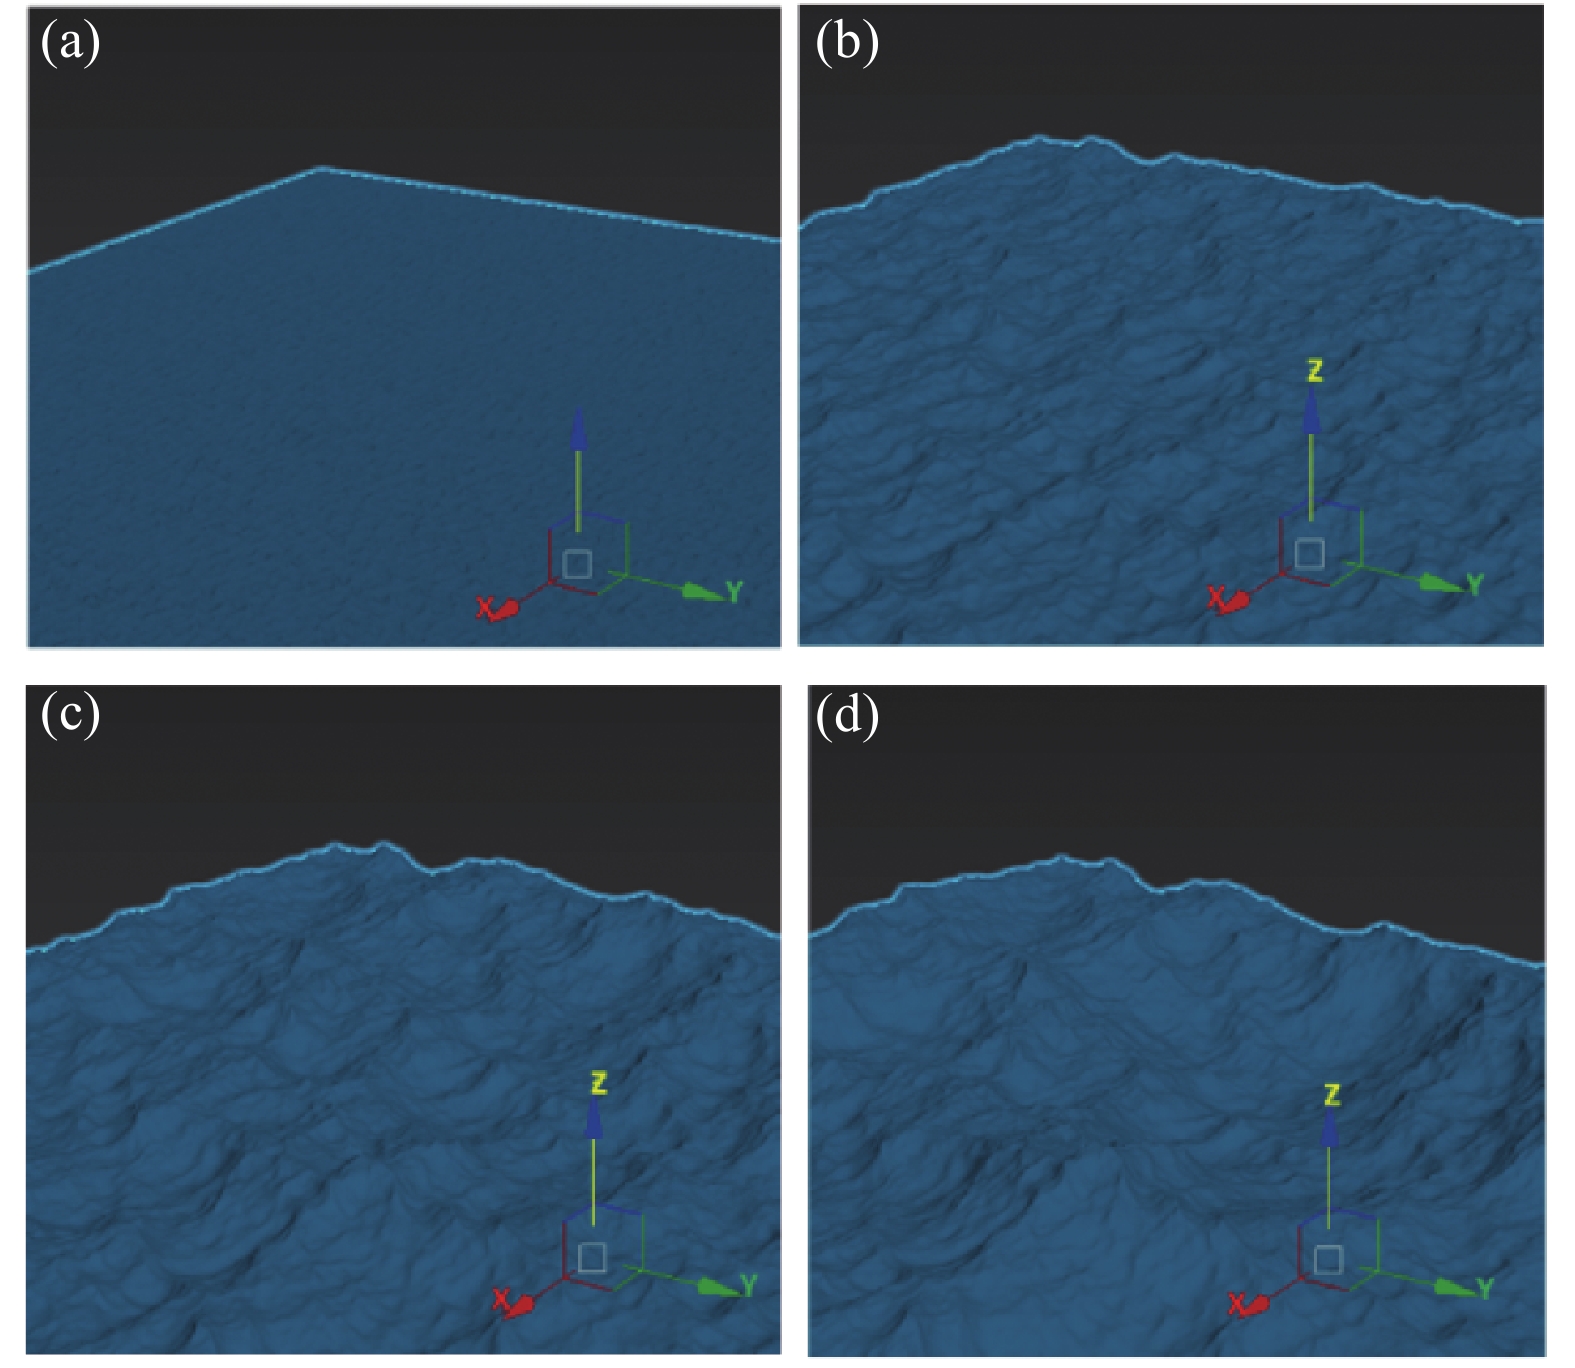
Fig. 2. 3D structure of the sea surface under different sea conditions. (a) Level 1 sea state; (b) Level 2 sea state; (c) Level 3 sea state; (d) Level 4 sea state
Fig. 3. BRDF of seawater at different wavebands calculated by 6S
Fig. 4. Reflectivity of the whitecaps at different zenith and azimuths angles
Fig. 5. Patch type judgment
Fig. 6. High-resolution satellite ocean background imaging simulation flowchart
Fig. 7. [in Chinese]
Fig. 7. Radiation field at the entrance pupil of the satellite under different wave levels. L1: Level 1 waves; L2: Level 2 waves; L3: Level 3 waves; L4: Level 4 waves
Fig. 8. ZY3-02 star PMS load spectral response function
Fig. 9. Calculated camera point spread function and MTF curve. (a) Point spread function; (b) MTF
Fig. 10. Comparison of simulation results with satellite data. (a) Simulating the sea surface of Band1; (b) ZY3-02 measured sea surface of Band1; (c) Simulating the sea surface of Band2; (d) ZY3-02 measured sea surface of Band2; (e) Simulating the sea surface of Band3; (f) ZY3-02 measuring the sea surface of Band3
Fig. 11. [in Chinese]
Fig. 11. Comparison of radiation distribution between simulated and measured results. (a) Simulating the sea surface of Band1; (b) ZY3-02 measured sea surface of Band1; (c) Simulating the sea surface of Band2; (d) ZY3-02 measured sea surface of Band2; (e) Simulating the sea surface of Band3; (f) ZY3-02 measuring the sea surface of Band3
|
Table 1. Sea state table
|
Table 2. Input parameter table of 6S
|
Table 3. Simulation conditions
| ||||||||||||||||||||||||||||||||||||||||||||||||||||||||||||||||||||||
Table 4. Comparison of simulation results and measured results


Set citation alerts for the article
Please enter your email address

© Copyright 2018-2021 | Chinese Laser Press. All Rights Reserved 沪ICP备15018463号-20