The photoelectric properties of In0.3Ga0.7As solar cells applied in laser wireless power transmission (LWPT) were studied when they were irradiated by 1070 nm continuous wave (CW) laser of various intensities. The influences of laser intensity on solar cell parameters extracted by the pollination algorithm were analyzed quantitatively. Results show that the conversion efficiency of the cell rose to the maximum and then decreased rapidly in the laser intensity range of 50–900 mW/cm2. With higher energy laser irradiation, the rise of ideality factor and reverse saturation current would lead to the degradation of voltage at the maximum power point, which was the main reason for the decrease of conversion efficiency. The results provide the basis for choosing the appropriate input energy in the case of different transmission systems.
Laser wireless power transmission (LWPT) was first proposed by Glaser[1] in 1968, who attempted to transmit the solar energy outside the atmosphere to the ground by laser and then converted it into electricity by solar cells. Compared with other wireless energy transmissions, LWPT owns the advantages of long transmission distance, high energy density, and dynamic transmission. Therefore, it can be widely applied in spacecraft, space bases, drones, robots, and fast charging[2–4].
A solar cell is the determinant factor of laser–electrical conversion efficiency at the receiving end of LWPT[5–8], as well as one of the main factors limiting the development of LWPT systems. Wireless power transmission of high energy density can be achieved by laser, in which high laser energy irradiates on small-area solar cells. Therefore, study on the photoelectric properties of solar cells under high laser illumination is very important for evaluating cell performance and selecting appropriate input laser energy for LWPT systems in different situations[9].
Generally, the photoelectric properties of a solar cell could be characterized by several parameters, such as the short circuit current (), open circuit voltage (), fill factor (), and efficiency ()[10]. The efficiency of the solar cell depends on the , , , and light intensity () and can be expressed as where and represent the current and voltage at the maximum power point, respectively.
Sign up for Chinese Optics Letters TOC. Get the latest issue of Chinese Optics Letters delivered right to you!Sign up now
The current–voltage (I–V) characteristics provide the most important information of the performance of the solar cell, which is usually described based on one diode model as
In Eq. (3), is the photo-generated current, is the diode ideality factor, is the reverse saturation current, and are the series and parallel resistance, respectively, is the electron charge, is the Boltzmann constant, and is the temperature of the cell.
The parameters mentioned above control the I–V characteristics of a cell at any given intensity of illumination and thus decide the values of the performance parameters and the efficiency of the cell. and both provide information about the charge recombination in the bulk space charge regions and the surface of the cell. is strongly affected by and . Moreover, basically depends on , , and and is inversely proportional to . As it is depicted in Ref. [11], a higher would introduce a higher but a lower . Therefore, accurate extraction of solar cell parameters under laser irradiation is of great importance for applications of LWPT.
Several methods have been proposed to extract parameters of the cell using I–V characteristics[12–19], in which the pollination algorithm was adopted, widely due to its advantages of simple operation, convenient implementation, and strong optimization ability. It is a global convergence search algorithm proposed by Yang in 2012 inspired by the pollination process[20]. Compared with other algorithms for extracting solar cell parameters, the pollination algorithm has higher convergence speed and parameter precision and is suitable for extracting parameters under different temperature and illumination conditions[17]. Due to the advantages above, the pollination algorithm was selected to extract the parameters of solar cells with the single-diode model in our research.
A fiber laser has higher photoelectric conversion efficiency and beam quality. It has wavelengths near 1000 nm, which are in the atmospheric window, and there is less transmission loss in the atmosphere. With the development of fiber lasers, the output power is increasing[21,22]. So, it is suitable for the LWPT system using fiber laser to transmit with longer distance and higher energy density[23]. As depicted above, a continuous fiber laser with the wavelength of 1070 nm was selected to irradiate solar cells to investigate the dependence of laser intensity and performance of solar cells. Various laser power densities ranging from 50 to were incident to the surface of solar cells in our experiments.
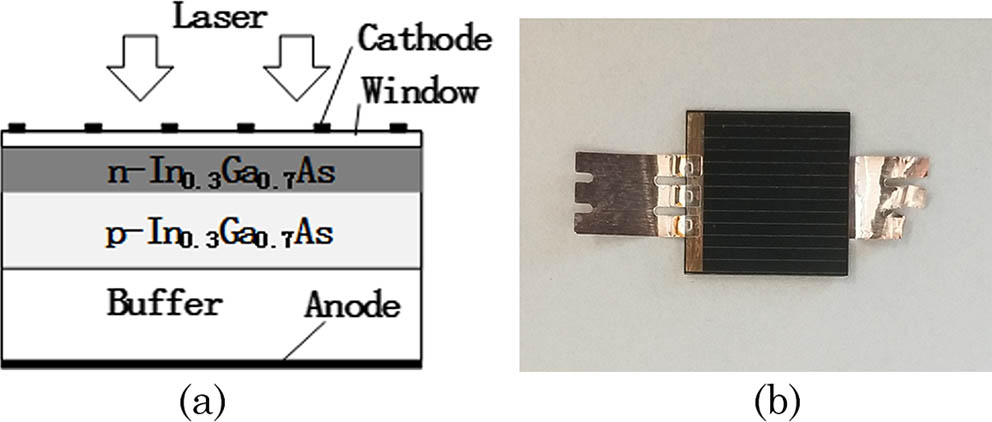
The solar cell used in this experiment was a single-junction solar cell fabricated by metal organic chemical vapor deposition (MOCVD) technology by the Shanghai Institute of Space Power-Sources[24]. The schematic diagram of the solar cell is shown in Fig. 1(a). The front surface was , as shown in Fig. 1(b), and the emitter region was -doped, forming an -type structure. The energy gap of material was . The temperature of the back surface of the solar cell was controlled at by a thermostat. A digital source meter was used to test and record the I–V curves of the cell at different laser irradiation levels.
Figure 1.(a) Schematic diagram of solar cell. (b) The picture of the solar cell.
The vector solution defined as (, , , , ) can be derived by the pollination algorithm within the ranges as follows[17,25]: μ
The objective function of the optimization algorithm was the root mean square error (RMSE). Finally, the five parameters obtained by the algorithm were used to calculate the I–V curves by the Newton method.
Ten groups of I–V curves of the solar cell with different laser energies were obtained. In the process of extracting five parameters, the calculated objective function RMSE was less than . The I–V curves are shown in Fig. 2, in which the solid symbols are the experimental results, and the lines denote the results calculated by the five parameters. The unit of incident laser intensity () is milliwatts per centimeter squared ().
Figure 2.I–V curves of the solar cell under different laser power densities. (The dots are experimental results, and the lines are calculation results. The unit of is .)
As can be seen from Fig. 2, the calculation results are consistent with the experimental results, and there is no significant difference between the two. This proves that it is reasonable to use the single-diode model to study the output characteristics of solar cells under laser irradiation and also verifies the high precision of the pollination algorithm in solving the five parameters of solar cells.
The performance parameters and the maximum power point of the solar cell can be easily extracted from Fig. 2 as well. The relationships between and with laser power are shown as Fig. 3. With the increase of , increases linearly. The blue hollow squares in the figure are experimental results, and the blue line is the linear fitting result with a fitting function of
Figure 3.Effects of on the current at short circuit and maximum power point. (The function in the figure is a linear fitting function of the short circuit current.)
It could be clearly observed that the curve did not pass through the origin, because the experiment was carried out in a non-dark room environment, in which the scattered light from the ambient environment induced photo-generated carriers inside the cell. The red solid squares in the figure are . Likewise, was nearly proportional to with a smaller slope than that of .
Figure 4 shows the variation of and with . The value (blue solid squares) increased exponentially with increasing , and the value increased by 14.3% in the range of . The value (red hollow squares) increased to the maximum value of about 0.49 V between and then began to decrease linearly with a further increase of . The inset shows the dependence of values on . The ratio of dropped linearly from 82% at to 62% at . It could be concluded that when the value rose, the value decreased, and the descending speed was higher than that of the increasing speed. With the increase of the value, of the solar cell decayed rapidly. The results of and induced by laser irradiation were similar to those irradiated by sunlight[26].
Figure 4.Effects of on the voltage at open circuit and maximum power point. The inset shows the relationship between and .
Figure 5 illustrates the dependency of the and values on . The value (red solid squares in the graph) increased slightly to the maximum of 0.755 near and then dropped linearly to 0.495 at . The relationship between and is similar to that of and , and the maximum value of was about 27.5% near and then decreased rapidly to 16.8%.
Figure 5.Effects of on fill factor and conversion efficiency.
According to Eqs. (1) and (2), and were directly related to and . increased linearly with , while the value of increased at first and then decreased with the increase of . The evolution trends of , , and were similar. Therefore, the main cause of the decrease in and could be attributed to the attenuation of . The relationship between and obtained in our experiments is the same as that in Ref. [9], in which the light-to-electricity conversion efficiency decreases with increased input laser power density (with ) invariably. In order to find out the genesis of the behaviors of solar cells to laser irradiation, the dependences of the five parameters on were investigated in the next paragraphs.
Figure 6 depicts the dependences of the and values on . As the value of increased, and decreased similarly, and the rate of decline became smaller. In the range of , the relative changes of and were 41.2% and 52.3%, respectively. According to Ref. [26], current leakage represented by would occur at the edge with local defects of the solar cell. Defects increase the concentration of local traps, forming active regions of recombination, which would capture photo-generated minority carriers[26,27]. With further increase of , solar cell performance degradation was also reflected in the decrease in [11], which was one of the reasons leading to the decrease of as well. Series resistance comes from electrode contact resistance and body resistance of the cell. With the increase of , the volume resistance decreased as with . However, the contact resistance does not change with the increase of incident energy. When further increased, the influence of bulk resistance on became smaller; consequently, the change rate of decreased[11].
Figure 6.Effects of on series and parallel resistances.
Figure 7 shows the dependency of and on . The trends of the variation of and with were analogous to each other. The values of and characterized the recombination situation in solar cells. Under low light intensity (as shown when ), carriers recombine through multiple recombination mechanisms, and the recombination rate does not alter with the change of light intensity. Therefore, and would not change with the light intensity. With the further increase of light intensity, Auger recombination increases and dominates the recombination in solar cells[26]. Thus, the values of and both increased with increasing , and the rate enlarged gradually.
Figure 7.Effects of on the ideality factor and reverse saturation current.
The quantum efficiency (QE) can be expressed as where is the photon flux of the incident light. According to Fig. 8, the total QE of the solar cell irradiated by laser was 0.59. In addition to the internal recombination loss, the reflection loss was more, resulting in lower QE values.
Fill factor is another representation of the curve factor of the I–V curves, which is directly controlled by the series and parallel resistances and ideality factor of the solar cell[26]. We can conclude from the above discussions that the decrease of shunt resistance and the rise of ideality factor with laser intensity increasing lead to the decrease of the fill factor. The decrease of parallel resistance was also the reason for voltage reduction at the maximum power point. As the QE reflects the utilization of photons, reducing the reflection of the incident laser and the recombination in the cell is an effective way to increase the photo-generated current. Thus, it is a good idea to optimize the structure of solar cells by improving the stability of the parallel resistance under high laser intensity. Moreover, more sophisticated processing technology and fewer defects in solar cells would own a positive effect on the falling of the ideality factor and reverse saturation current. Through the above improvements, the fill factor of the solar cell can be effectively improved, and the conversion efficiency of the solar cell can be enhanced synchronously.
In conclusion, various parameters of solar cells under 1070 nm continuous wave (CW) laser irradiation were studied. The parameters of solar cells under different irradiation conditions were extracted by the pollination algorithm. The rationality and accuracy of parameter extraction were verified by comparing the results of calculation and experiment. The experimental results showed that , , and increased with increasing , where increased linearly, and and had similar evolution trends. and decreased with increasing , and the slope declined. , , and rose at first and decreased subsequently with a similar trend in the range of . These results show that the performance of solar cells under laser irradiation can be adjusted by selecting the incident laser energy . In addition, reducing the reflection of the solar cell and optimizing the internal recombination can greatly improve the output performance of the solar cell so that it can adapt better in energy transmissions of long distance and high power. Results presented in this Letter can provide a reference in the field of solar cell applications.
[2] T. He, S. Yang, H. Zhang, C. Zhao, P. Xu, J. He, H. Wang. Chin. J. Lasers, 40, 0317001(2013).
[3] Z. Li, Y. Zhang, Y. Ai, X. Feng. Laser. Technol., 42, 306(2017).
[4] Z. Li, D. Shi, J. Shen, Z. Ma. Space. Electron. Tech., 3, 71(2013).
[5] H. Yugami, Y. Kanamori, H. Arashi, M. Niino, A. Moro, K. Eguchi, Y. Okada, A. Endo. IECEC-97 Proceedings of the Thirty-Second Intersociety Energy Conversion Engineering Conference , 625(1997).