• Photonics Research
  • Vol. 4, Issue 1, 0013 (2016)
Takashi Ito1、*, Ondrej Slezak2, Masahiro Yoshita1, Hidefumi Akiyama1, and Yohei Kobayashi1
Author Affiliations
  • 1Institue for Solid State Physics, University of Tokyo, Kashiwanoha, Kashiwa, Chiba 277-8581, Japan
  • 2HiLASE Centre, Institute of Physics ASCR, v.v.i., Za Radnici 828, 25241 Dolni Brezany, Czech Republic
  • show less
    DOI: 10.1364/prj.4.000013 Cite this Article Set citation alerts
    Takashi Ito, Ondrej Slezak, Masahiro Yoshita, Hidefumi Akiyama, Yohei Kobayashi. High-precision group-delay dispersion measurements of optical fibers via fingerprint-spectral wavelength-to-time mapping[J]. Photonics Research, 2016, 4(1): 0013 Copy Citation Text show less
    Schematic experimental configuration for the group-delay dispersion measurement of optical fibers via fingerprint-spectral wavelength-to-time mapping.
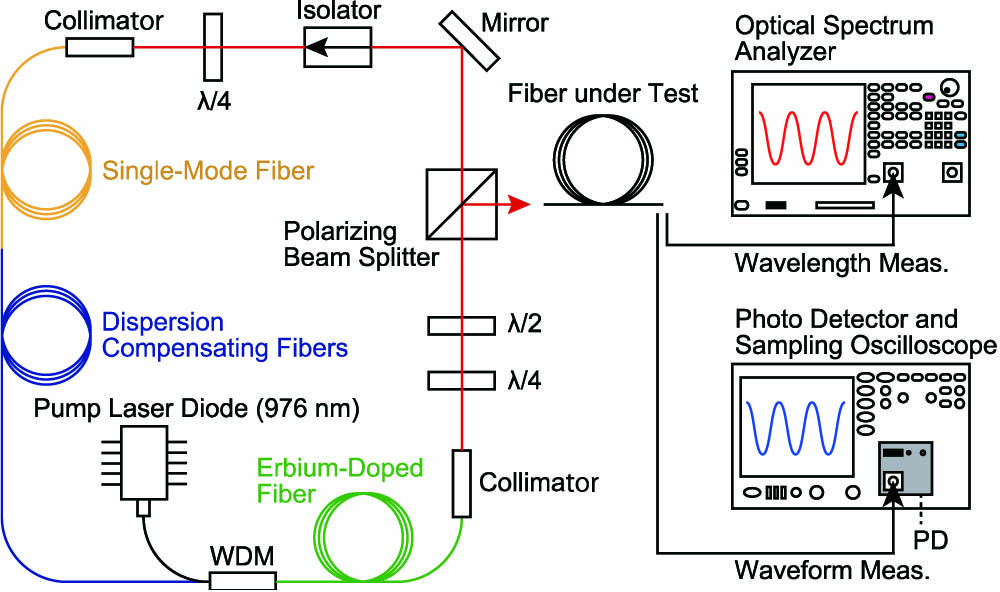
    Fig. 1. Schematic experimental configuration for the group-delay dispersion measurement of optical fibers via fingerprint-spectral wavelength-to-time mapping.
    (a) Wavelength spectrum of input pulses into the test fiber. (b) Time waveform of the input pulses corresponding to an impulsive time response of the measurement system. The inset figure shows autocorrelation traces of the input pulses. The blue curve is a measured trace, whereas the red curve is the squared magnitude of the inverse Fourier transformation of the input power spectrum shown in (a).
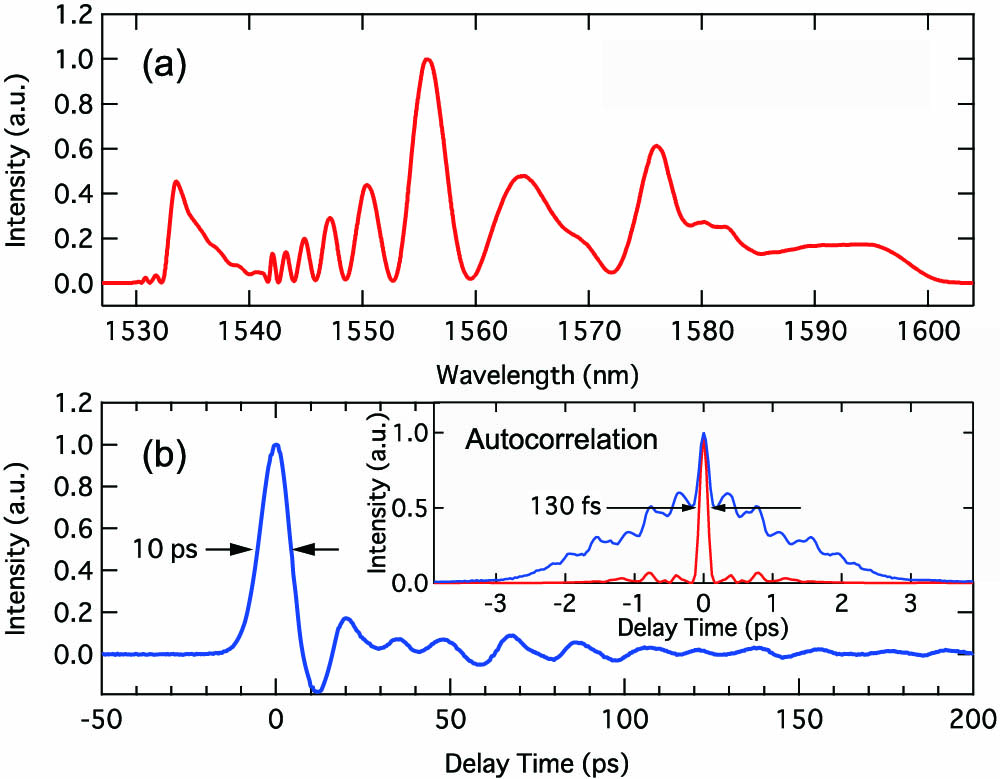
    Fig. 2. (a) Wavelength spectrum of input pulses into the test fiber. (b) Time waveform of the input pulses corresponding to an impulsive time response of the measurement system. The inset figure shows autocorrelation traces of the input pulses. The blue curve is a measured trace, whereas the red curve is the squared magnitude of the inverse Fourier transformation of the input power spectrum shown in (a).
    (a) Wavelength spectrum of output pulses from the test fiber. (b) Time waveform of the output pulse. The black sticks indicate peak and nadir positions.
    Fig. 3. (a) Wavelength spectrum of output pulses from the test fiber. (b) Time waveform of the output pulse. The black sticks indicate peak and nadir positions.
    Fitting result of the least-squares method. The blue curve is a deconvolved waveform of the output waveform in Fig. 3(b) and the system response function in Fig. 2(b). The red curve is a model function calculated from the output spectrum in Fig. 3(a) and a chromatic-dispersion model.
    Fig. 4. Fitting result of the least-squares method. The blue curve is a deconvolved waveform of the output waveform in Fig. 3(b) and the system response function in Fig. 2(b). The red curve is a model function calculated from the output spectrum in Fig. 3(a) and a chromatic-dispersion model.
    DispersionFit to All 4003 DataFit to 16 Data at Peaks and NadirsReference [29]
    β2(fs2/mm)21.186±0.00521.23±0.09>23
    β3(fs3/mm)120.9±0.5130±10<135
    β4(fs4/mm)2200±804000±3000N/A
    Table 1. Group-Delay Dispersion per Unit Length of SMF-28e+ at 1550 nm
    Takashi Ito, Ondrej Slezak, Masahiro Yoshita, Hidefumi Akiyama, Yohei Kobayashi. High-precision group-delay dispersion measurements of optical fibers via fingerprint-spectral wavelength-to-time mapping[J]. Photonics Research, 2016, 4(1): 0013
    Download Citation