Abstract
The group-delay dispersion of an optical fiber was measured with the time-of-flight method, using fingerprint-like characteristic spectra from a mode-locked fiber laser source. To determine the group-delay dispersion up to the fourth order, least-squares fitting was applied to the overall time waveform mapped on the time axis for the fingerprint- spectral broadband pulses through a long optical fiber. The analysis of all 4003 data points reduced statistical uncertainty, and provided second-, third-, and fourth-order dispersion with uncertainties of 0.02%, 0.4%, and 4%, respectively.1. INTRODUCTION
Optical fibers are capable dispersive media that enable us to control total dispersion by adjusting the length of the fibers. They lend themselves to various applications such as pulse stretchers, compressors, soliton generators, mode-locked lasers, and spectrometers [1–4]. The precision of the dispersion control in these applications depends on a precise determination of the group-delay dispersion of the optical fibers in question.
To characterize the group-delay dispersion in optical fibers, swept-wavelength interferometry, phase-shift methods, and time-of-flight methods have been performed [5–7].
Swept-wavelength interferometry analyzes spectral interference fringes by inserting a test fiber into the side arm of an interferometer [8–12]. Fringe analysis is effective for short-length fibers because it allows for the precise characterization of small amounts of dispersion. Furthermore, measurement uncertainty is less than 1% for second-order dispersion. Swept-wavelength interferometry has also been applied for long-length optical fibers with well-known reference media in the other side arm.
Sign up for Photonics Research TOC. Get the latest issue of Photonics Research delivered right to you!Sign up now
Alternatively, the phase-shift method measures differential group delays via the observation of phase shifts with sweeping wavelengths from a tunable continuous-wave optical source [13–16]. This method is applicable for long fibers and fiber systems. In practice, the phase shifts are measured alternately at a reference wavelength and at the wavelength of interest, and then the differential delay is calculated. By increasing the number of measurement points, a measurement uncertainty of second-order dispersion less than 1% has been achieved. Recent external-cavity lasers allow for fast continuous tuning, which is advantageous for precise measurements.
Last, the time-of-flight method (utilized in optical time-domain reflectometry, for example) proceeds by measuring the group delays of input pulses sent into long optical fibers. Typical time-of-flight measurements detect propagation times of the transmitted pulses, and the central wavelength of the pulses varies in order to allow for the precise measurement of dispersion [17,18]. However, such measurements are less precise, by the order of a percent, in comparison to the other methods mentioned above.
A problem associated with lengthy, fragile fibers and systems is that their optical lengths fluctuate or change in time owing to vibrations and other instabilities that result from environmental conditions. However, to obtain group-delay dispersion, it is necessary to measure light propagation at many wavelengths. If one sweeps or scans the wavelength in order to measure many wavelengths, the measurement time becomes long in proportion to the number of data points. With instabilities that unavoidably exist in lengthy, fragile fibers, a longer operation time yields larger systematic uncertainties. Indeed, measurements over 100 wavelengths have been difficult to achieve with the typical time-of-flight method because of the instabilities and limitations in measurement time. Therefore, the precision has been decreased as a result of statistical uncertainty by the finiteness of the number of data points.
In recent decades, group delays have been obtained at several wavelengths simultaneously. Most of the work has delivered pulses with spiky multiple peaks in the spectrum to a test fiber for mapping on the time waveform and analyzed the propagation time of data points corresponding to peaks and nadirs in the pulse spectrum [19–24]. Meanwhile, Tong et al. suggested the possibility of using least-squares analysis for all data points on noninterferometric spectra [25].
In this study, we demonstrated the least-squares analysis combined with fingerprint-like characteristic broadband spectra. The optical pulses were directly generated from a mode-locked fiber laser and input into a 1 km long fiber to obtain the time waveforms of output pulses from the fiber. The group-delay dispersion, up to the fourth order, was then assessed, and the statistical uncertainties of second-, third-, and fourth-order dispersion were reduced to 0.02%, 0.4%, and 4%, respectively.
2. METHODS
Figure 1 presents the schematic experimental configuration of the measurement system. The optical pulses from the stable optical source were input into the fiber under test, after which the spectra and time waveforms of output pulses were measured with the optical spectrum analyzer and the combination of a photo detector and a sampling oscilloscope, under an environmental temperature of 23°C. A passive mode-locked nonlinear-polarization-rotation erbium-doped-fiber laser was developed as a stable optical source, with an optical 30 m long ring-type cavity and a low repetition rate of 10 MHz. The cavity consisted of a single-mode fiber and dispersion compensating fibers. The active fiber was pumped by the laser diode at a lasing wavelength of 976 nm. By adjusting the balance between the lengths of the four fibers, the total dispersion of the cavity was reduced to nearly zero. As a result of the high peak intensity of the optical pulses in the ring cavity (attributed to both the low repetition rate of 10 MHz and the zero total dispersion), the broadened, complex, and characteristic spectrum was generated by the assistance of self-phase modulation. The spectrum envelope width was about 70 nm. The wide bandwidth partly supported the measurement precision of high-order dispersion. Direct generation of the fingerprint spectrum from the cavity enabled simple and stable measurements. The average output power from the cavity was 4 mW, which was then attenuated to 53 μW by a neutral density filter to avoid spectrum distortion due to nonlinear effects. The optical pulses were coupled to a single-mode fiber 2 m in length, and were then delivered to a test fiber, which was a typical fiber (i.e., SMF-28e+ from Corning Inc.) with a length of 1 km. To characterize the spectra of input and output pulses, an optical spectrum analyzer (AQ6317B from Ando Electric Co., Ltd.) was used. The wavelength resolution of the spectrum analyzer was set to 0.5 nm. A 40 GHz photo detector (New Focus Model 1014 from Newport Corp.) and a 50 GHz sampling oscilloscope (86100D Infiniium DCA-X from Keysight Technologies Inc.) were used to evaluate the time waveforms of the input and output pulses of the test fiber. An optical trigger of the fiber laser oscillator was used to trigger the sampling oscilloscope.
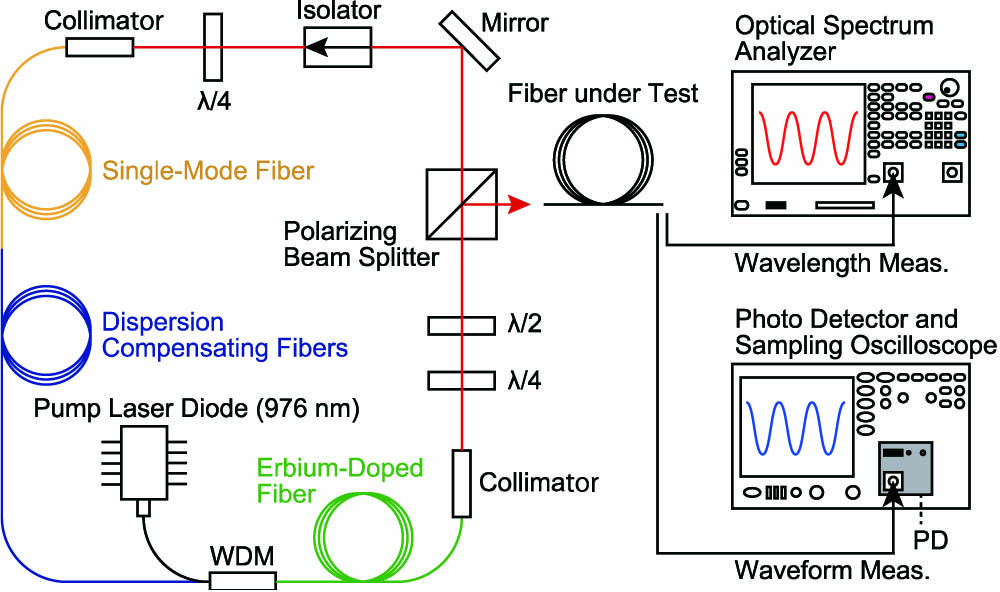
Figure 1.Schematic experimental configuration for the group-delay dispersion measurement of optical fibers via fingerprint-spectral wavelength-to-time mapping.
3. RESULTS
Figure 2 shows (a) the spectrum and (b) the time waveform of the input pulse into the test fiber. The input spectrum illustrates the complex and characteristic fingerprint spectrum of the fiber laser oscillator. The spectrum ranged from 1530 to 1600 nm. The inset in Fig. 2(b) shows an autocorrelation trace of the input pulse. The blue curve shows the measured results, whereas the red curve represents the results calculated as the squared magnitude of the inverse Fourier transformation of the input power spectrum in Fig. 2(a). The input pulses are not Fourier-transform-limited, and are accompanied by tails due to spectral phase distortion. However, the pedestal did not affect the dispersion measurement. The curve in Fig. 2(b) shows the experimental results of the time waveform of the input pulse. The time waveform corresponds to the response function of the measurement system because the duration of the input pulse was much shorter than 10 ps. The peak position on the time waveform was defined as the delay time of 0 s.

Figure 2.(a) Wavelength spectrum of input pulses into the test fiber. (b) Time waveform of the input pulses corresponding to an impulsive time response of the measurement system. The inset figure shows autocorrelation traces of the input pulses. The blue curve is a measured trace, whereas the red curve is the squared magnitude of the inverse Fourier transformation of the input power spectrum shown in (a).
Figure 3 shows the experimental results for the output pulse from the test fiber. Figure 3(a) shows the output spectrum. The spectrum shape does not change compared to the input pulse in Fig. 2(a). Figure 3(b) reveals the experimental results of evaluated time waveforms of the output pulses. Because of the group-delay dispersion in the test fiber, the pulsewidth was broadened to about 1 ns. It is clear that thefingerprint-spectral structure of the optical source was mapped on the time axis. The delay time of the output pulse was about 5 μs. Figures 3(a) and 3(b) allow us to clearly visualize the delays of each wavelength component in the fingerprint spectrum as they traveled through the test fiber.
Figure 3.(a) Wavelength spectrum of output pulses from the test fiber. (b) Time waveform of the output pulse. The black sticks indicate peak and nadir positions.
To analyze the group-delay dispersion from the wavelength spectra and time waveforms, we used a Taylor-expanded chromatic-dispersion model [26]: Herein, is the group delay in the test fiber, is the angular frequency of the electric field, and ( is the speed of light in vacuum). , , , and are the first-, second-, third-, and fourth-order dispersion, respectively. , , , and are the dispersion per unit length. is the length of the test fiber.
In Fig. 4, the blue curve is the group delay obtained by deconvolution of the output time waveform in Fig. 3(b) with the response function of the measurement system in Fig. 2(b). The red curve is a least-squares fitted curve by the output spectrum in Fig. 3(a) and Eq. (1). The least-squares method searched for a parameter set , , , and minimizing , which consists of 4003 data points of the group delay. This analysis assessed the dispersion with standard deviation or statistical uncertainty as follows: , , , and . The uncertainty was evaluated by using uncertainty propagation with the sample variances and error matrix elements when was minimized [27,28].
Figure 4.Fitting result of the least-squares method. The blue curve is a deconvolved waveform of the output waveform in Fig. 3(b) and the system response function in Fig. 2(b). The red curve is a model function calculated from the output spectrum in Fig. 3(a) and a chromatic-dispersion model.
To derive the values of , , , and , we need to know the fiber length . However, the present time-of-flight method requires a long fiber to evaluate , , , and with high accuracy, and an accurate, direct measurement of the length is difficult to achieve. Therefore, we determined the length via our measured value of and the value of at measured independently by the fiber supplier [29]. The length has five digits of accuracy because had five digits of accuracy. High-order dispersion values per unit length by using the length are shown to be , , and . These values are summarized in Table 1.
| Dispersion | Fit to All 4003 Data | Fit to 16 Data at Peaks and Nadirs | Reference [29] |
|---|
| β2(fs2/mm) | −21.186±0.005 | −21.23±0.09 | >−23 |
| β3(fs3/mm) | 120.9±0.5 | 130±10 | <135 |
| β4(fs4/mm) | −2200±80 | −4000±3000 | N/A |
Table 1. Group-Delay Dispersion per Unit Length of SMF- at 1550 nm
4. DISCUSSION
Note that the uncertainty of the group-delay dispersion per unit length , , and stemmed from the statistical , , and uncertainties influenced by the deviations of the least-squares fitting in Fig. 4. The least-squares fitting for the delay time slightly deviates systematically toward the vertical upper direction around 4.908 μs and toward the lower direction around 4.909 μs. The deviations stem not from statistical fluctuation but from systematic uncertainties caused by uncertainties in the wavelength sensitivity of the spectrum analyzer, the wavelength resolution, the time resolution of the detectors (photo detector and sampling oscilloscope), the deconvolution process, and so on.
To compare with the conventional time-of-flight method, we read the peak and nadir positions in the spectrum and time waveform shown as 16 black sticks in Fig. 3, and fitted the only 16 data points by Eq. (1). As the result, , , , and were obtained. The same procedure as explained above determined the length , and the dispersion per unit length: , , and (Table 1). The uncertainty of this result is larger than that of the result with all data points. The comparison of these methods indicates that using only 16 points corresponding to peaks and nadirs yields the uncertainty as the statistical fluctuation. The present method, which analyzes by the least-squares fitting for all 4003 data points from the complex fingerprint spectrum and waveform mapped on the time axis, can reduce the fluctuation to a negligible level.
Here we note the limitations of the present method in terms of test fiber length for lower and upper bounds. The lower bound is . The adjacent peaks are indistinguishable on the time axis, if the time interval of the peaks is shorter than the system time resolution. This value is given by , where 10 ps is the system time resolution, and a value of is the peak interval of the finest spectral structure in Fig. 3(a) at 1543 nm. The upper bound is . The broadened pulses are overlapped on the time axis, thus rendering the present method inapplicable for measuring the pulse delay, if the pulsewidth is wider than the input-pulse period. This value is given by , where 100 ns is the input-pulse period, and a value of is the bandwidth of the spectrum in Fig. 3(a). The test fiber length of 1 km is comparable to the lower bound. If the fiber length approaches these bounds, deconvolution analysis becomes necessary. The deconvolution effectively works if noise is a negligible level compared with the convoluted signal variations.
In general, measurements of group-delay dispersion are susceptible to group-delay ripples caused by multiple reflections in optical components and to the polarization mode dispersion of fibers. The present method can be less susceptible to the group-delay ripples for the following reason. In time-of-flight methods, multiple reflections at distant surfaces cause delayed signals owing to extra optical path length. Thus, direct pulses that arrive without multiple reflections can be selectively detected within a proper time window. This is equivalent to removing group-delay ripples due to multiple reflections. As for the polarization mode dispersion, dispersion fluctuation due to polarization rotation is caused by changes in the test-fiber configuration during the measurement. Because the present method measures the group delays at many wavelengths simultaneously, the dispersion is determined at a configuration of the test fiber. In this sense, the present method is robust against fluctuations, and less susceptible to changes in the configuration.
If one accurately measures the dispersion and length of optical fibers with longer lengths, and/or reduces the abovementioned systematic uncertainties, the present method allows one to accomplish more precise fiber dispersion measurements. In addition, the method would be applicable to measure different types of fibers such as normal dispersion fibers, specialty fibers with complex dispersion characteristics, and gain dispersive fibers.
5. CONCLUSION
The high-precision group-delay dispersion measurement of the optical fiber was performed using least-squares analysis for all data points on the measured waveforms combined with the fingerprint spectrum via wavelength-to-time mapping. The statistical uncertainties of the second-, third-, and fourth-order dispersion were reduced to 0.02%, 0.4%, and 4%, respectively.
Acknowledgment
Acknowledgment. This work was partly supported by KAKENHI No. 15H03968 and No. 26610081 from JSPS, the Photon Frontier Network Program of MEXT, JST-SENTAN, and JST-CREST in Japan and by the European Regional Development Fund, the European Social Fund, and the state budget of the Czech Republic (project HiLASE: CZ.1.05/2.1.00/01.0027, project Postdok: CZ.1.07/2.3.00/30.0057).
References
[1] D. Strickland, G. Mourou. Compression of amplified chirped optical pulses. Opt. Commun., 55, 447-449(1985).
[2] L. Mollenauer, R. Stolen, J. Gordon. Experimental observation of picosecond pulse narrowing and solitons in optical fibers. Phys. Rev. Lett., 45, 1095-1098(1980).
[3] J. Kafka, T. Baer, D. Hall. Mode-locked erbium-doped fiber laser with soliton pulse shaping. Opt. Lett., 14, 1269-1271(1989).
[4] K. Goda, K. Tsia, B. Jalali. Serial time-encoded amplified imaging for real-time observation of fast dynamic phenomena. Nature, 458, 1145-1149(2009).
[5] L. Cohen. Comparison of single-mode fiber dispersion measurement techniques. J. Lightwave Technol., LT-3, 958-966(1985).
[6] G. Chauvel. Dispersion in Optical Fibers(2008).
[7] E. Neumann. Single-Mode Fibers: Fundamentals(1988).
[8] M. Tateda, N. Shibata, S. Seikai. Interferometric method for chromatic dispersion measurement in a single-mode optical fiber. IEEE J. Quantum Electron., QE-17, 404-407(1981).
[9] P. Merritt, R. Tatam, D. Jackson. Interferometric chromatic dispersion measurements on shot lengths of monomode optical fiber. J. Lightwave Technol., 7, 703-716(1989).
[10] J. Lee, D. Kim. Versatile chromatic dispersion measurement of a single mode fiber using spectral white light interferometry. Opt Express, 14, 11608-11615(2006).
[11] M. Galle, S. Saini, W. Mohammed, L. Qian. Chromatic dispersion measurements using a virtually referenced interferometer. Opt. Lett., 37, 1598-1600(2012).
[12] Inometrix Inc.. Virtual Reference Dispersion Analyzer(2012).
[13] T. Ozeki, A. Watanabe. Measurements of wavelength dependence of group delay in a multimode silica fiber. Appl. Phys. Lett., 28, 382-383(1976).
[14] B. Costa, D. Mazzoni, M. Puleo, E. Vezzoni. Phase shift technique for the measurement of chromatic dispersion in optical fibers using LED’s. IEEE J. Quantum Electron., 18, 1509-1515(1982).
[15] Photon Kinetics. Model 2800 Chromatic Dispersion Measurement System(2003).
[16] Keysight Technologies. 86038B Photonic Dispersion and Loss Analyzer Technical Specifications(2007).
[17] L. Cohen, C. Lin. Pulse delay measurements in the zero material dispersion wavelength region for optical fibers. Appl. Opt., 16, 3136-3139(1977).
[18] Anritsu Inc.. CMA5000a CD-OTDR Specifications(2010).
[19] K. Mori, T. Morioka, M. Saruwatari. Group velocity dispersion measurement using supercontinuum picosecond pulses generated in an optical fibre. Electron. Lett., 29, 987-989(1993).
[20] P. Kelkar, F. Coppinger, A. Bhushan, B. Jalali. Time-domain optical sensing. Electron. Lett., 35, 1661-1662(1999).
[21] J. Maran, R. Slavík, S. LaRochelle, M. Karásek. Chromatic dispersion measurement using a multiwavelength frequency-shifted feedback fiber laser. IEEE Trans. Instrum. Meas., 53, 67-71(2004).
[22] V. Pagé, L. Chen. Measuring chromatic dispersion of optical fiber using time-of-flight and a tunable multi-wavelength semiconductor fiber laser. Opt. Commun., 265, 161-170(2006).
[23] J. Hult, R. Watt, C. Kaminski. Dispersion measurement in optical fibers using supercontinuum pulses. J. Lightwave Technol., 25, 820-824(2007).
[24] H. Chi, J. Yao. Fiber chromatic dispersion measurement based on wavelength-to-time mapping using a femtosecond pulse laser and an optical comb filter. Opt. Commun., 280, 337-342(2007).
[25] Y. Tong, L. Chan, H. Tsang. Fibre dispersion or pulse spectrum measurement using a sampling oscilloscope. Electron. Lett., 33, 983-985(1997).
[26] G. Agrawal. Nonlinear Fiber Optics(1995).
[27] P. Bevington. Data Reduction and Error Analysis for the Physical Sciences(1969).
[28] T. Awaya. Data Analysis: Analog and Digital(1994).
[29] Corning Inc.. SMF-28e+ Optical Fiber: Product Information—PI1463(2013).


