
Min Yang, Wenbin Xu, Yuze Tian, Zhenyuan Sun, Xianzhong Sun. Time-Sharing Infrared Polarization Imaging System for Moving Target Detection[J]. Acta Optica Sinica, 2020, 40(15): 1511001
- Acta Optica Sinica
- Vol. 40, Issue 15, 1511001 (2020)
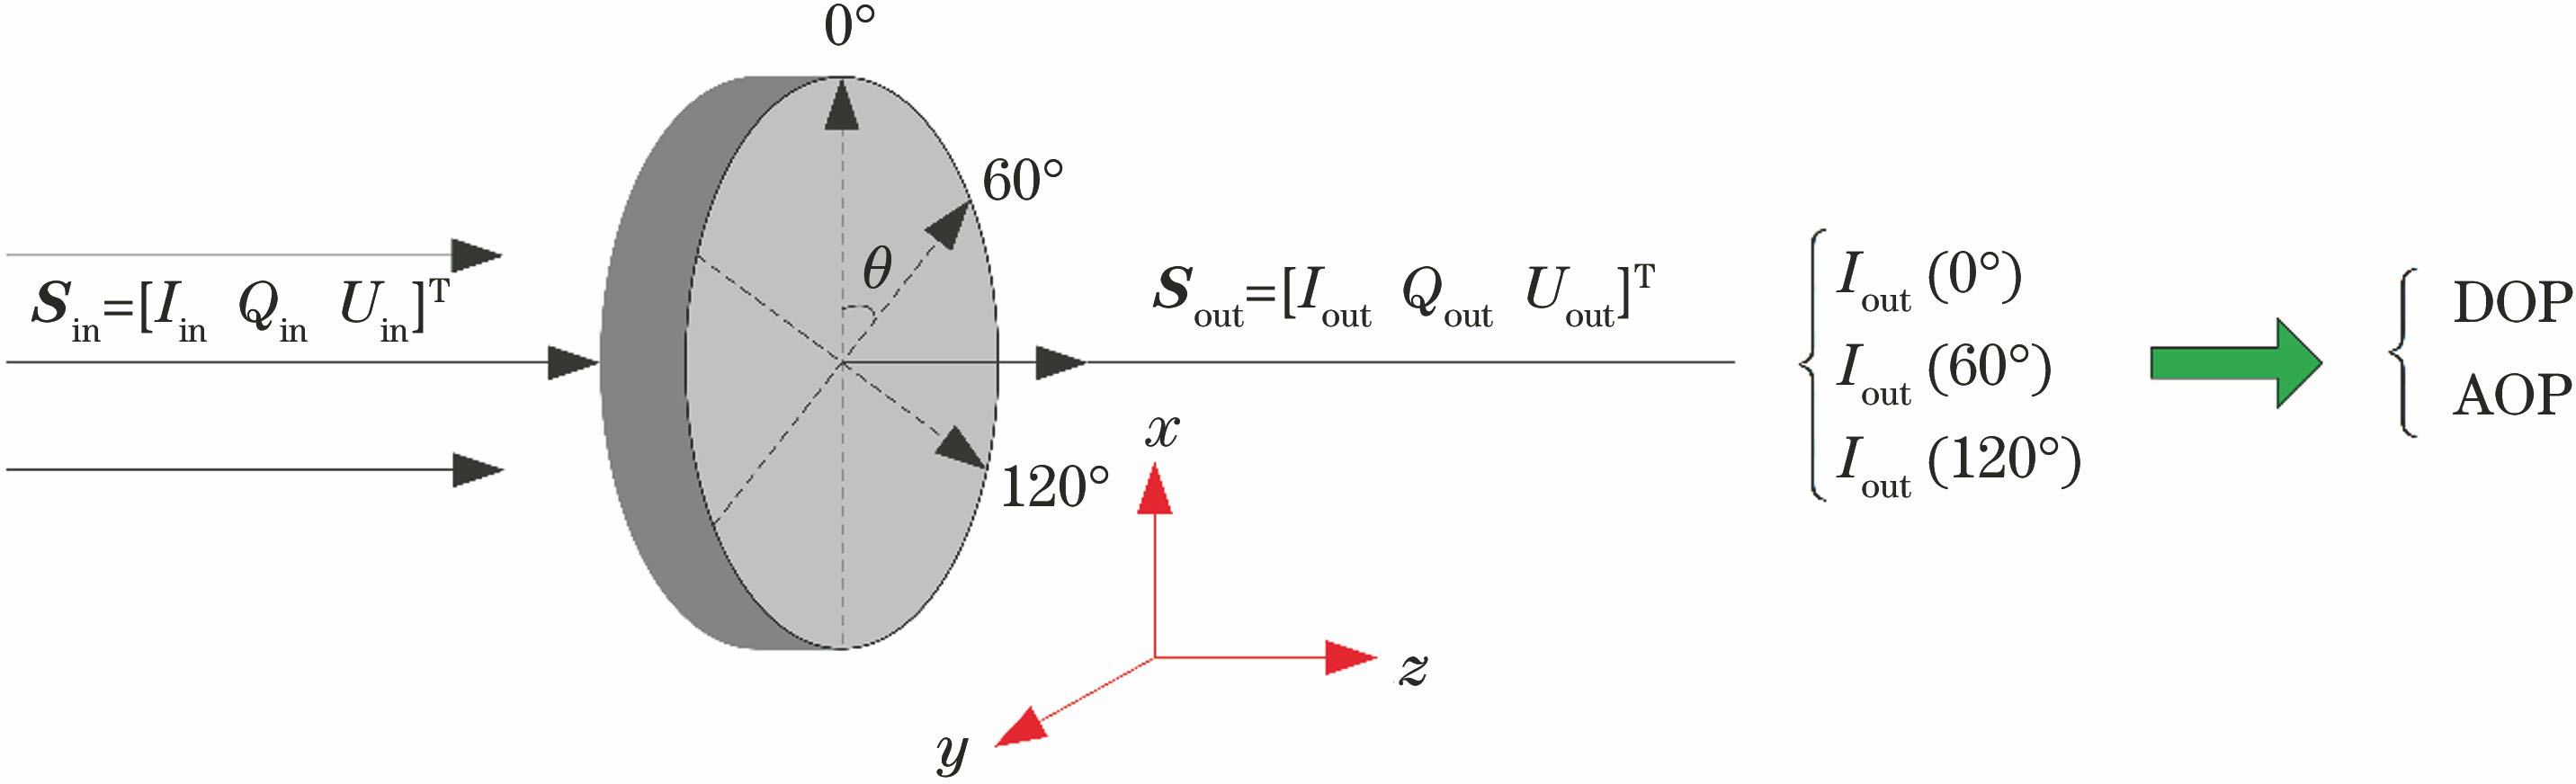
Fig. 1. Schematic of measuring principle of light wave polarization state
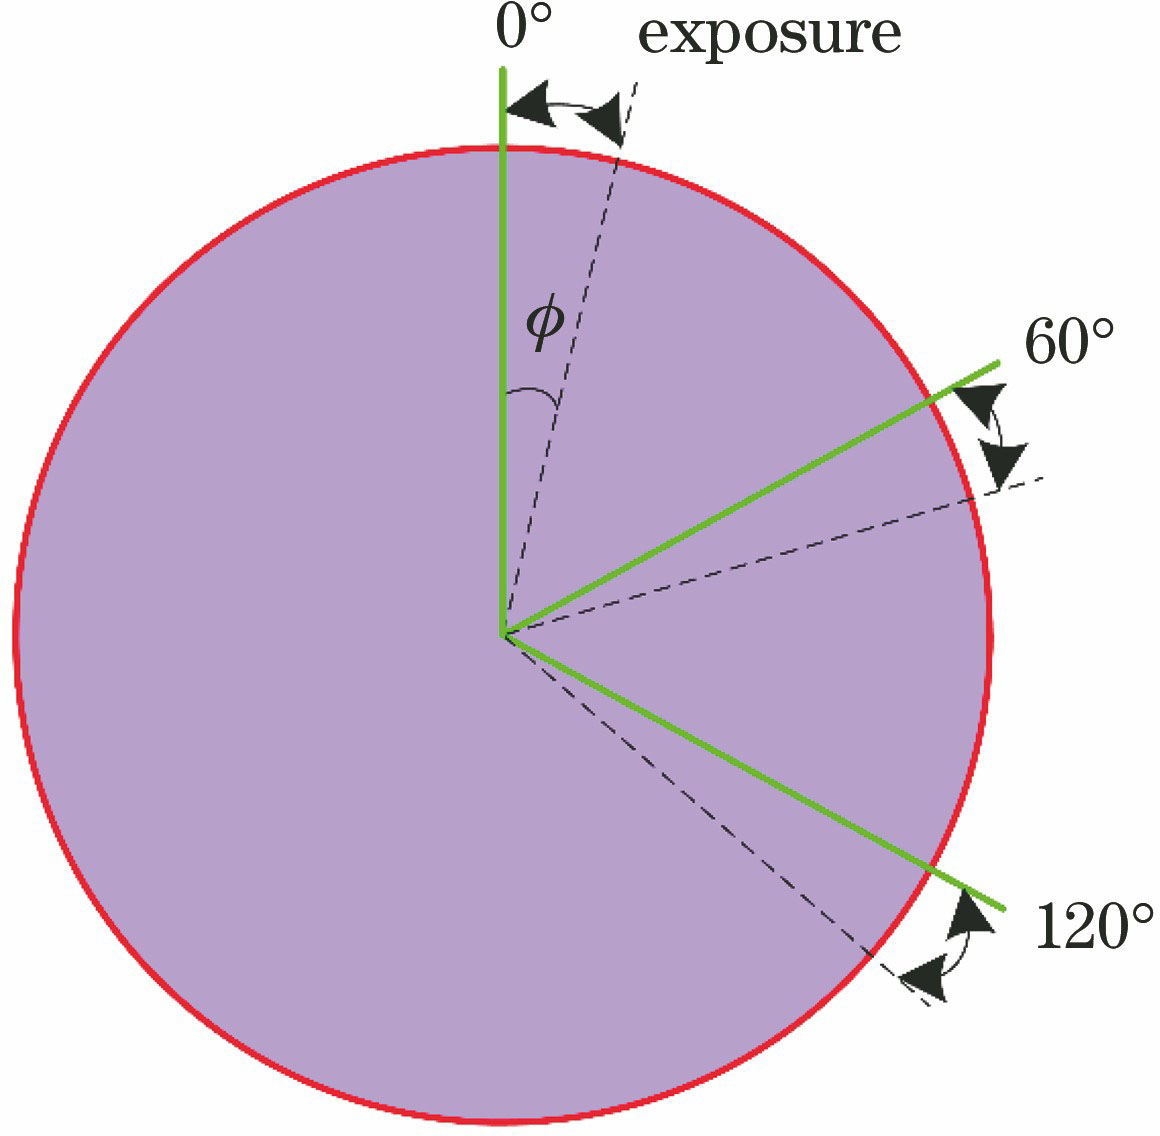
Fig. 2. Schematic of polarizer angle change during each rotation period
Fig. 3. Process of solving infrared polarized images by iterative sorting method
Fig. 4. Typical infrared polarized cold reflection phenomenon
Fig. 5. Infrared DOP and infrared AOP images with different rotation periods. (a) (b) (c) Infrared polarization degree images with rotation periods of 400, 600, 900 r/min; (d) (e) (f) corresponding infrared polarization angle images
Fig. 6. Infrared DOP and infrared AOP images with different integration times. (a) (b) (c) Infrared polarization degree images with integration times of 0.5, 1.0, and 1.5 ms; (d) (e) (f) corresponding infrared polarization angle image
Fig. 7. Cold reflection effect deduction processing results. (a) Infrared intensity images with different polarization directions; (b) cold reflection spot reference images; (c) corrected infrared intensity images
Fig. 8. polarization polarization images of airbus. (a) Intensity image; (b) DOP image; (c) AOP image
| ||||||||||||||||||||||||
Table 1. Comparison of infrared DOP and infrared AOP values in different regions with different rotation periods
| ||||||||||||||||||||||||
Table 2. Comparison of infrared DOP and infrared AOP values in different regions with different integration time
|
Table 3. Airbus infrared image contrast results

Set citation alerts for the article
Please enter your email address
© Copyright 2018-2021 | Chinese Laser Press. All Rights Reserved 沪ICP备15018463号-20