Author Affiliations
1Emergent Photonics (Epic) Lab, Department of Physics and Astronomy, University of Sussex, Brighton BN1 9QH, UK2City University of Hong Kong, Tat Chee Avenue, Hong Kong, China3Centre for Microphotonics, Swinburne University of Technology, Hawthorn, VIC 3122, Australia4INRS-EMT, 1650 Boulevard Lionel-Boulet, Varennes, Québec J3X 1S2, Canada5Institute of Fundamental and Frontier Sciences, University of Electronic Science and Technology of China, Chengdu 610054, China6National Research University of Information Technologies, Mechanics and Optics, St. Petersburg, Russia7Xi’an Institute of Optics and Precision Mechanics, Chinese Academy of Sciences, Xi’an 710119, Chinashow less
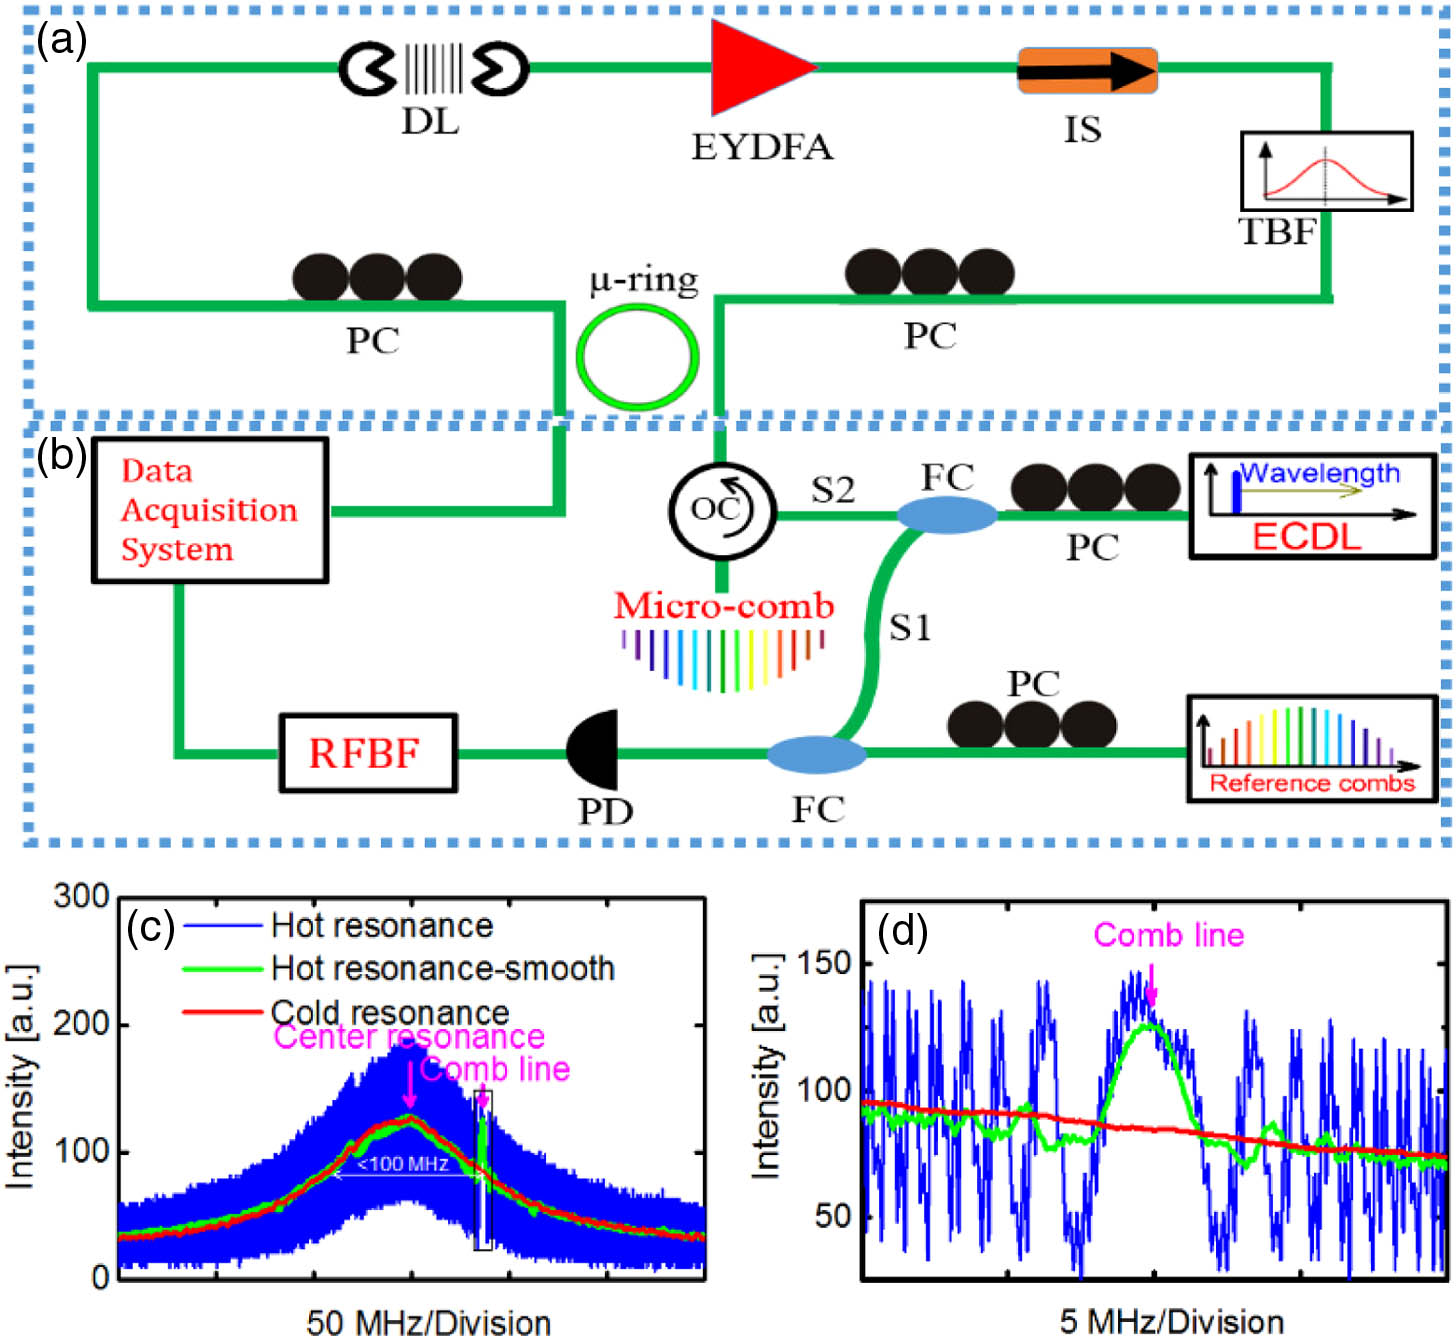
Fig. 1. (a) Experimental setup of the FD-FWM laser. In the setup, a nonlinear high-Q micro-ring resonator is nested in a fiber ring cavity, which contains an optical amplifier (EYDFA), a free-space delay line (DL), a tunable passband filter (TBF), a Faraday isolator (IS), and a polarization controller (PC). (b) Frequency-comb-assisted spectroscopy scheme, which consists of a tunable external cavity diode laser (ECDL) and a reference comb. A scanning CW laser was split into two signals, which are labeled S1 and S2, to perform frequency calibration and the spectroscopy of the micro-ring resonance, respectively. The beating of the tunable laser and the reference comb is extracted with a photodiode (PD) and radio frequency bandpass filter (RFBF). (c) A typical spectroscopy measurement of the micro-cavity resonances and (d) zoom in view. A Lorentzian-shaped resonance (red) combined with the beat note between the probe laser and the oscillating comb line (blue and green). The micro-comb line can be determined by assessing the position where an abrupt phase change takes place, reported in (d), by pink arrow.
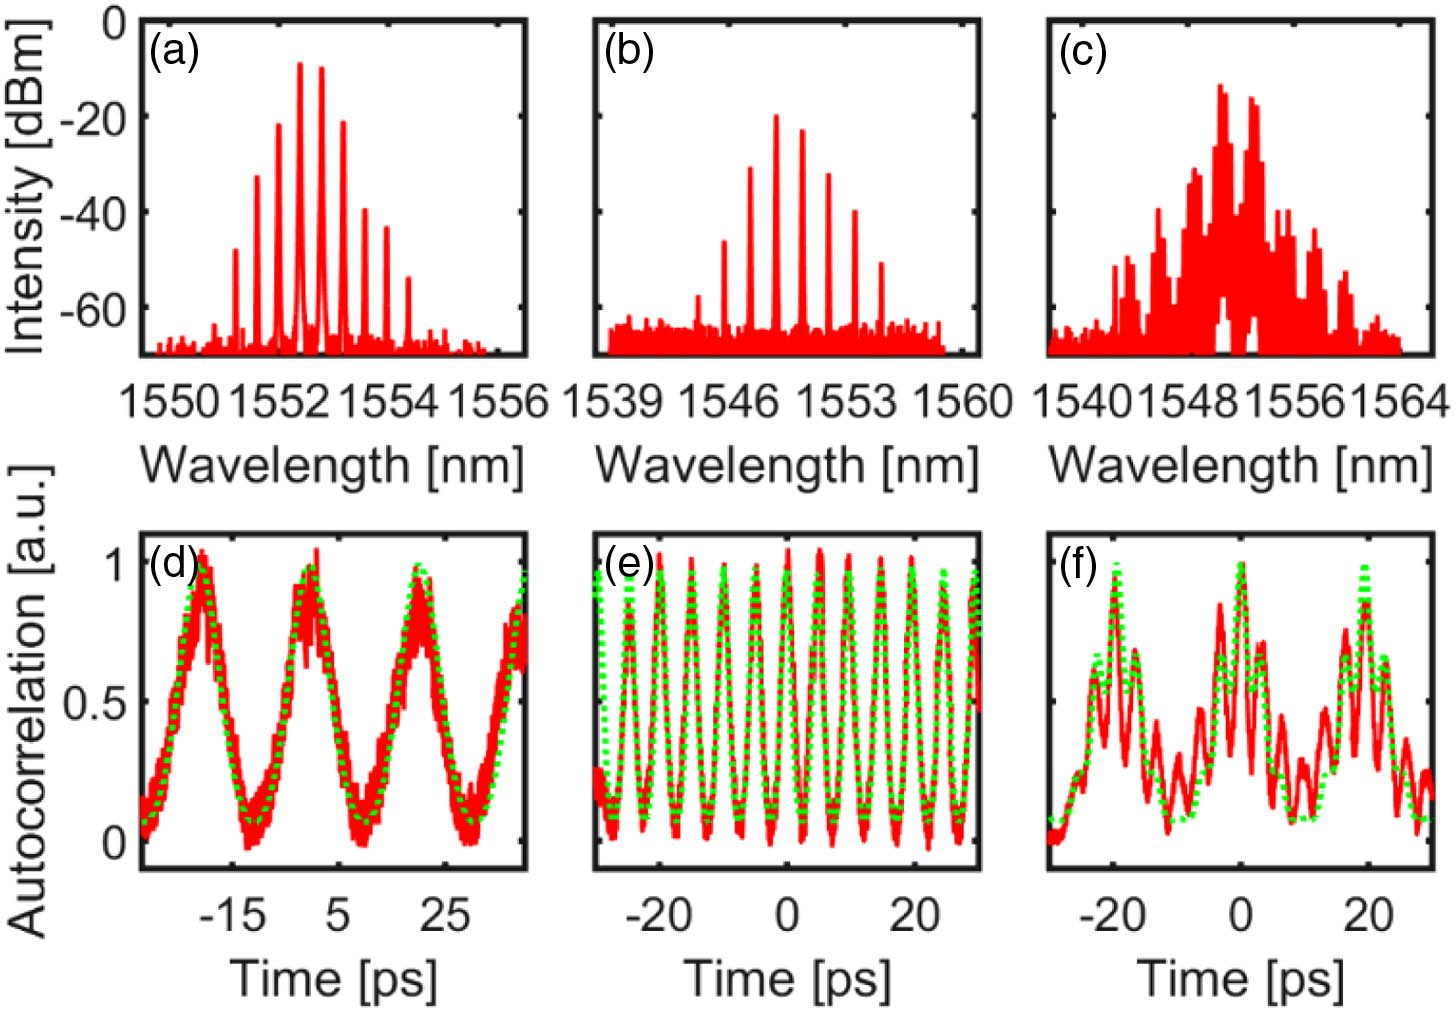
Fig. 2. (a)–(c) Experimental optical spectra and (d)–(f) autocorrelation traces of the laser output for frequency spacings at (a), (d) a single FSR, and (b), (e) multiple FSRs, for the primary comb. (c) and (d) report a Type-II comb.
Fig. 3. Experimental optical spectra of the Type-II micro-comb laser output. A mode-locking state at ∼300 GHz repetition rate (6 times the fundamental repetition rate of the micro-resonator) is overlaid as a red dotted line. The subgroups of Type-II combs around the primary comb lines 1, 7, 13, and 19 are highlighted in black, blue, green, and magenta, respectively.
Fig. 4. (a)–(d) Resonance profiles of the primary combs, as numbered in Fig. 3, and (e)–(h) one set of sub-combs around the primary comb line 13.
Fig. 5. (a) Frequency line position versus mode number. Dots are measurements related to the subset around the primary lines 1, 7, 13, and 19 (as highlighted in Fig. 3 and plotted in black, blue, green, and magenta, respectively). Error bars are within the marker size. The results are fitted with a straight line with angular coefficient 48.952 GHz±3 MHz, which takes into account the error of the measured frequencies due to the accuracy of our frequency-comb-assisted spectroscopy system. (b) Residual plot. Error bars are within the marker size. It shows clearly that all the sub-combs have, within our accuracy, the same FSR but are detuned of 4 times the main-cavity FSR (∼293 MHz).
Fig. 6. (a)–(c) Simulated optical spectra and (d)–(f) AC of the laser output with frequency spacing at 1, 4, and 8 FSR. The saturation power ratios are 1, 40, and 100, respectively. The cavity-period detunings (δ, see text) are 0, 0.25, and 0.125 for (a) and (d), (b) and (e), and (c) and (f), respectively.
Fig. 7. (a)–(d) Simulated optical spectra, (e)–(h) AC (blue) and normalized temporal evolution of the intensity (red) of 8 FSR primary combs and Type-II combs. Here, the saturation powers are in a ratio 1, 2, 2.5, 3.5 for (a) and (e), (b) and (f), (c) and (g), and (d) and (h), respectively.