Author Affiliations
1University of Science and Technology of China, Hefei 230026, Anhui, China2Key Laboratory of Optical Calibration and Characterization, Anhui Institute of Optics and Fine Mechanics, HFIPS, Chinese Academy of Sciences, Hefei 230031, Anhui, Chinashow less
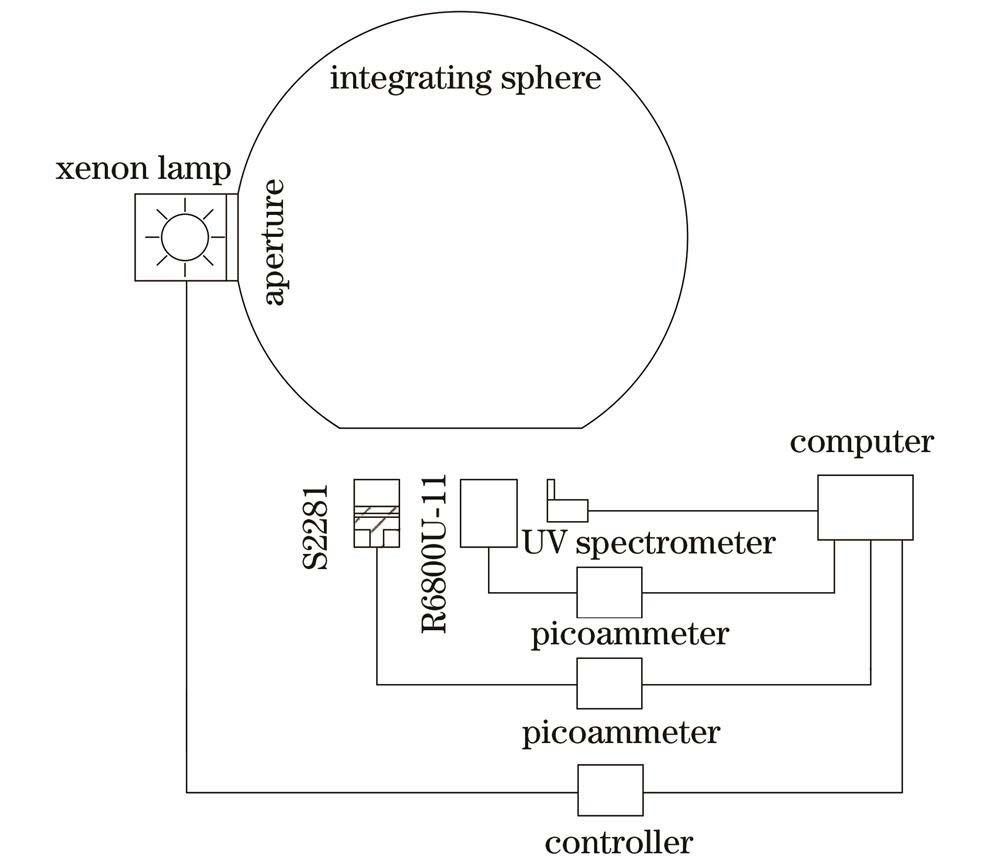
Fig. 1. Linear measurement device of solar blind phototube detection system
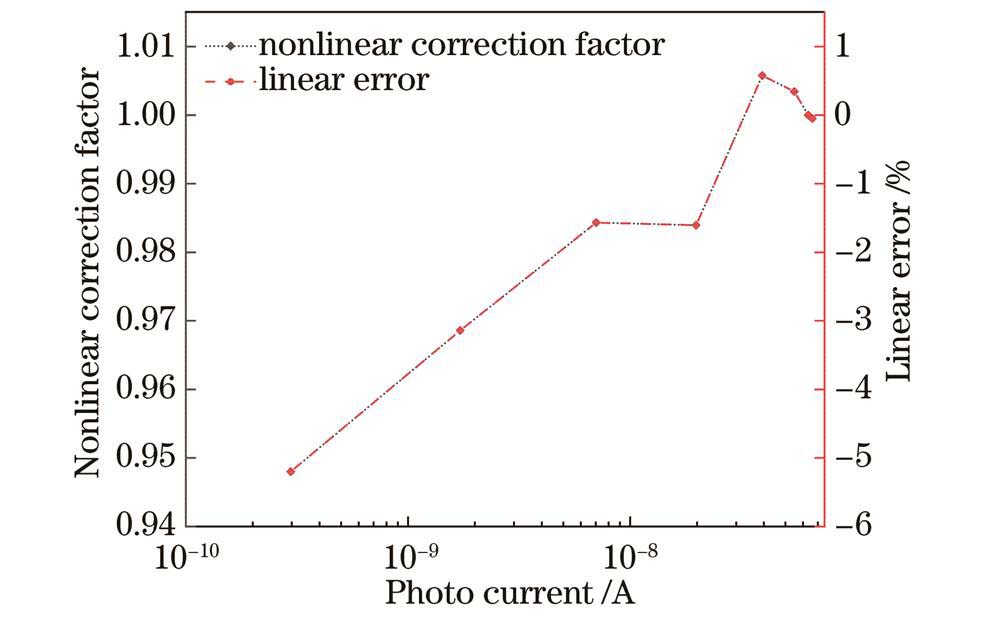
Fig. 2. Response nonlinear calibration results of solar blind phototube detection system
Fig. 3. Change of relative spectral radiance of xenon lamp light source with time
Fig. 4. Linear fitting results of response photocurrents of reference detector and detector to be tested
Fig. 5. Correlated coefficient, original response photocurrent, and relative error of response photocurrents of detector to be tested and reference detector. (a) Correlated coefficient; (b) original response photocurrent values; (c) relative error
Fig. 6. Experimental results of reference detector and light source current changes. (a) Linear fitting result; (b) response nonlinear calibration results; (c) current change of light source over time
| Parameter | S2281 | R6800U-11 |
|---|
| Spectral response range /nm | 190 to 1100 | 160 to 350 | | Photocathode material | Si | Cs-Te | | Dark current /pA | 50@VR=10 mV and 25 ℃ | 1 | | Recommended operating voltage /V | — | 15 | | Ambient temperature /℃ | -10 to 60 | -80 to 50 | | Radiant sensitivity /(A/W) | 0.12@200 nm and 25 ℃ | 0.02@254 nm and 25 ℃ | | Input window material | Quartz | Quartz | | Active area size /mm | 11.3 | 8 |
|
Table 1. Parameters of Si photodiode S2281 and phototube R6800U-11
[25-26] | Range | 5¹/₂ digit default resolution | Accuracy(1YR)±(% RDG.+ offset)18-28 °C,0-70% RH | Typical RMS noise | Analog rise time (10% to 90%) |
|---|
| 2 nA | 10 fA | 0.4%+400 fA | 20 fA | 8 ms | | 20 nA | 100 fA | 0.4%+1 pA | 100 fA | 8 ms | | 200 nA | 1 pA | 0.2%+10 pA | 1 pA | 500 μs | | 2 μA | 10 pA | 0.15%+100 pA | 10 pA | 500 μs | | 20 μA | 100 pA | 0.1%+1 nA | 100 pA | 500 μs | | 200 μA | 1 nA | 0.1%+10 nA | 1 nA | 500 μs | | 2 mA | 10 nA | 0.1%+100 nA | 10 nA | 500 μs | | 20 mA | 100 nA | 0.1%+1 μA | 100 nA | 500 μs |
|
Table 2. Characteristic parameters of 6485 picoammeter (Keithley)
[27] | Measurement point | Response photocurrent of S2281 /A | Response photocurrent of R6800U-11 /A | Relative responsivity | Relative error /% |
|---|
| 1 | 9.314×10⁻¹² | 1.384×10⁻¹² | 0.149 | -1.056 | | 2 | 4.641×10⁻¹¹ | 6.374×10⁻¹² | 0.137 | 6.591 | | 3 | 2.053×10⁻¹⁰ | 2.806×10⁻¹¹ | 0.137 | 7.062 | | 4 | 2.128×10⁻⁹ | 2.965×10⁻¹⁰ | 0.139 | 5.268 | | 5 | 1.207×10⁻⁸ | 1.718×10⁻⁹ | 0.142 | 3.210 | | 6 | 4.863×10⁻⁸ | 7.034×10⁻⁹ | 0.145 | 1.639 | | 7 | 1.369×10⁻⁷ | 1.979×10⁻⁸ | 0.145 | 1.676 | | 8 | 2.662×10⁻⁷ | 3.934×10⁻⁸ | 0.148 | -0.505 | | 9 | 3.719×10⁻⁷ | 5.484×10⁻⁸ | 0.147 | -0.270 | | 10 | 4.308×10⁻⁷ | 6.330×10⁻⁸ | 0.147 | 0.073 | | 11 | 4.500×10⁻⁷ | 6.610×10⁻⁸ | 0.147 | 0.122 |
|
Table 3. Relative response values and relative error at each measurement point
| Measurement point | Measured value of R6800U-11 /% | Measured value of S2281 /% |
|---|
| 1 | 180.9796 | 1.7538 | | 2 | 39.2955 | 0.3520 | | 3 | 8.9255 | 0.0795 | | 4 | 0.8448 | 0.0070 | | 5 | 0.1458 | 0.0012 | | 6 | 0.0328 | 0.0012 | | 7 | 0.0117 | 0.0004 | | 8 | 0.0067 | 0.0002 | | 9 | 0.0048 | 0.0002 | | 10 | 0.0042 | 0.0001 | | 11 | 0.0040 | 0.0001 |
|
Table 4. Influence of dark background noise on measured values of each measurement point
| Measurement point | Measured value of R6800U-11 /% | Measured value of S2281 /% |
|---|
| 1 | 146.804 | 1.850 | | 2 | 20.055 | 0.700 | | 3 | 5.131 | 0.573 | | 4 | 1.073 | 0.473 | | 5 | 0.464 | 0.418 | | 6 | 0.360 | 0.361 | | 7 | 0.313 | 0.285 | | 8 | 0.208 | 0.205 | | 9 | 0.170 | 0.165 | | 10 | 0.162 | 0.158 | | 11 | 0.157 | 0.152 |
|
Table 5. Influence of noise on measured values of each measurement point
| Measurement point | Root mean square value of R6800U-11 /A | Root mean square value of S2281 /A |
|---|
| 1 | 2.032×10⁻¹² | 1.723×10⁻¹³ | | 2 | 1.278×10⁻¹² | 3.246×10⁻¹³ | | 3 | 1.440×10⁻¹² | 1.176×10⁻¹² | | 4 | 3.181×10⁻¹² | 1.006×10⁻¹¹ | | 5 | 7.967×10⁻¹² | 5.043×10⁻¹¹ | | 6 | 2.534×10⁻¹¹ | 1.754×10⁻¹⁰ | | 7 | 6.184×10⁻¹¹ | 3.896×10⁻¹⁰ | | 8 | 8.168×10⁻¹¹ | 5.457×10⁻¹⁰ | | 9 | 9.301×10⁻¹¹ | 6.147×10⁻¹⁰ | | 10 | 1.027×10⁻¹⁰ | 6.812×10⁻¹⁰ | | 11 | 1.036×10⁻¹⁰ | 6.853×10⁻¹⁰ |
|
Table 6. Root mean square values of noise at each measuring point
| Photo current /A | Nonlinear correction factor | Relative standard deviation /% |
|---|
| Group 1 | Group 2 | Group 3 | Group 4 | Group 5 | Group 6 | Group 7 | Group 8 |
|---|
| 1.239×10⁻⁹ | 0.993 | 0.993 | 0.990 | 0.997 | 0.993 | 0.994 | 0.990 | 0.995 | 0.222 | | 7.087×10⁻⁹ | 1.000 | 0.997 | 0.995 | 0.998 | 0.997 | 1.008 | 0.994 | 0.997 | 0.422 | | 2.873×10⁻⁸ | 1.001 | 0.998 | 1.002 | 0.998 | 1.000 | 1.001 | 1.005 | 0.995 | 0.296 | | 7.833×10⁻⁸ | 1.001 | 1.000 | 1.002 | 0.998 | 1.000 | 1.003 | 1.003 | 1.001 | 0.158 | | 1.527×10⁻⁷ | 1.003 | 1.001 | 1.001 | 1.001 | 1.003 | 1.001 | 1.000 | 1.001 | 0.108 | | 2.140×10⁻⁷ | 0.998 | 1.000 | 1.002 | 1.000 | 1.002 | 0.999 | 0.999 | 1.001 | 0.151 | | 2.494×10⁻⁷ | 1.001 | 0.998 | 1.001 | 0.999 | 1.001 | 1.002 | 1.000 | 1.000 | 0.127 | | 2.647×10⁻⁷ | 0.997 | 1.001 | 0.999 | 0.999 | 0.999 | 1.001 | 1.003 | 0.997 | 0.212 |
|
Table 7. Data of nonlinear correction factor for various response photo current
| Measurement point | Nonlinear correction factor | Relative standard deviation /% |
|---|
| Group 1 | Group 2 | Group 3 | Group 4 | Group 5 | Group 6 | Group 7 | Group 8 |
|---|
| 1 | 1.180 | 0.934 | 0.752 | 1.148 | 0.670 | 1.425 | 0.928 | 1.049 | 24.107 | | 2 | 0.978 | 0.913 | 0.898 | 0.971 | 0.933 | — | 0.901 | 0.949 | 3.471 | | 3 | 0.930 | 0.927 | 0.927 | 0.934 | 0.920 | 0.946 | 0.927 | 0.929 | 0.826 | | 4 | 0.949 | 0.946 | 0.946 | 0.949 | 0.948 | 0.949 | 0.948 | 0.948 | 0.139 | | 5 | 0.968 | 0.967 | 0.968 | 0.970 | 0.969 | 0.969 | 0.969 | 0.968 | 0.098 | | 6 | 0.982 | 0.983 | 0.984 | 0.986 | 0.985 | 0.985 | 0.985 | 0.984 | 0.123 | | 7 | 0.981 | 0.984 | 0.985 | 0.985 | 0.984 | 0.985 | 0.984 | 0.984 | 0.129 | | 8 | 1.001 | 1.004 | 1.006 | 1.007 | 1.007 | 1.008 | 1.007 | 1.007 | 0.242 | | 9 | 0.998 | 1.001 | 1.003 | 1.004 | 1.005 | 1.005 | 1.005 | 1.005 | 0.256 | | 10 | 0.995 | 0.998 | 1.000 | 1.001 | 1.002 | 1.002 | 1.002 | 1.001 | 0.259 | | 11 | 0.994 | 0.998 | 0.999 | 1.000 | 1.001 | 1.001 | 1.001 | 1.001 | 0.241 |
|
Table 8. Data of nonlinear correction factor for each measurement point
| Influence factor | Uncertainty /% |
|---|
| Surface nonuniformity(integrating sphere) | 0.800 | | Angle nonuniformity(integrating sphere) | 0.500 | | Standard detector | 0.422 | | Repeatability | 0.259 | | Dark background | 0.845 | | Standard transfer process | 0.473 | | Detection system to be tested(phototube,picoammeter,source meter) | 1.073 | | Combined uncertainty | 1.795 | | Expanded uncertainty(confidence factor k=2) | 3.591 |
|
Table 9. Combined uncertainty of measurement system