
Xiang WANG, Gao-fang YIN, Nan-jing ZHAO, Ting-ting GAN, Rui-fang YANG, Zhi-song QIN, Ming DONG, Min CHEN, Zhi-chao DING, Pei-long QI, Lu WANG, Ming-jun MA, De-shuo MENG, Jian-guo LIU. Fast Measurement of Primary Productivity in the Yellow Sea and Bohai Sea Based on Fluorescence Kinetics Technology[J]. Spectroscopy and Spectral Analysis, 2022, 42(3): 990
- Spectroscopy and Spectral Analysis
- Vol. 42, Issue 3, 990 (2022)
Abstract
Keywords
0 Introduction
Reliable assessment of phytoplankton primary productivity is crucial to understanding marine carbon geochemical cycling and the oceanic ecosystem function. As the basis of the marine food web[
Traditionally, the rates of phytoplankton primary productivity have been measured by tracing the evolution of O2 or the assimilation of CO2. These methods are time and money consuming and cannot meet the needs of in situ and rapid monitoring of marine primary productivity. With the rapid development of satellite and remote sensing technology, watercolor sensors began to be applied to the real-time and high-resolution measurement of marine primary productivity globally. However, the in-situ verification requirements of remote sensing data and the weather interference cannot be ignored. Since the 1990s, the chlorophyll fluorescence method has been introduced into the aquatic ecosystem. Because of no need for sample cultivation, non-invasiveness and high measurement resolution, the chlorophyll fluorescence method has been widely used to measure phytoplankton photosynthetic fluorescence parameters and the rapid and in situ detection of marine primary productivity[
In this paper, based on the fluorescence kinetic method, an instrument for measuring phytoplankton primary productivity has been developed. The phytoplankton primary productivity can be quickly obtained with the bio-optical model by measuring the fluorescence kinetic curve[
1 Measurement principle and system
1.1 Principle of fluorescence kinetics measurement
The phytoplankton primary productivity is measured by the oxygen evolution rate or CO2 absorption efficiency in tradition, while it is characterized by the electron transport rate in the fluorescence kinetic method. Theoretically, the electron transport rate is consistent with the oxygen evolution rate or CO2 absorption efficiency[
![]()
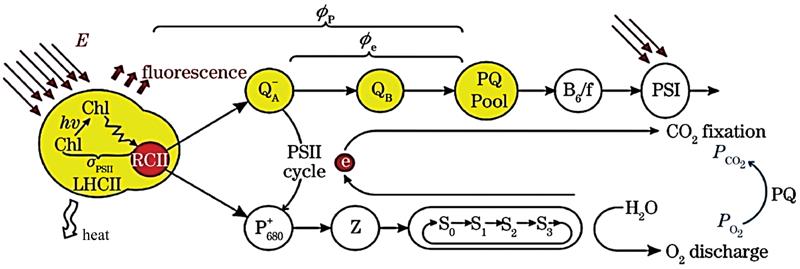
Figure 1.Schematic diagram of energy flow and electron transport during photosynthesis
The primary charge separation takes place in the reaction center of chlorophyll. The generated high-energy electrons promote electron transfer on the photosynthetic film. Under irradiation, the oxidant
The light energy absorbed by the reaction center is used for photochemical reactions and dissipated in the form of fluorescence and thermal emission. The fluorescence yield depends on the intensity of the excitation light. The chlorophyll fluorescence yield versus time during the excitation process is shown in Figure 2.
![]()
Figure 2.Chlorophyll fluorescence kinetic curve
During the single turn-over time, with energy accumulates, QA is gradually unable to receive electrons, which eventually causes the electron transport chain to be blocked. The excess energy is dissipated in the form of fluorescence, causing the fluorescence yield to rise from the static minimum fluorescence Fo and reach the maximum fluorescence yield Fm, which is the fast phase process of fluorescence kinetics. When the excitation light is stopped, the reaction center reopens with the re-oxidation process of
1.2 Measuring system
In order to achieve accurate acquisition of fluorescence kinetic curves of different types of phytoplankton, a multi-band excitation light source, a high-accuracy drive circuit for adjusting the excitation light source and a fast-phase fluorescence detection circuit were designed, and a fast measuring instrument for phytoplankton primary productivity was developed. The instrument mainly consisted of four modules: excitation light source unit, fluorescence detection unit, control unit, and related optical structure. The system structure of the developed instrument and its physical photo is shown in Figure 3.
![]()
Figure 3.The system structure of the developed instrument and its physical photo
LEDs with three bands of 469, 520, and 624 nm were used as the excitation light source, which could meet the detection needs of different algae in the actual aquatic ecosystem. The excitation drive unit, composed of a DSP pulse signal generator, MOSFET tube, drive chip and other peripheral devices, could achieve precise control of the intensity of the excitation light source. The maximum driving pulse current of the circuit was up to 18A. Fast phase excitation light intensity could be adjusted from 0 to 36 000 μmol quanta·m-2·s-1. Fast phase fluorescence detection was mainly the photodetector, I/V conversion, compensator, broadband amplifier and high-speed sampler. The fluorescence signal was first converted into an electrical signal and then a digital signal by high-speed A/D for fluorescence data analysis. The main control unit mainly completes the generation of the light pulse excitation signal, signal synchronization sampling, A/D data acquisition, and at the same time, communicates with the PC to complete the measurement of the fluorescence kinetic curve. The optical structure adopted the integrated design of the focused excitation light path and the fluorescence collection light path, which could improve the excitation efficiency of the light source and the collection efficiency of fluorescence signal.
The chlorophyll fluorescence kinetic curve is obtained using the developed instrument above. During the excitation process, the fluorescence yield f(t) can be expressed by formula (1).
Among them, Fo is the initial fluorescence yield of all reaction centers of PSⅡ in a completely open state; Fm is the maximum fluorescence yield when all PSⅡ reaction centers are closed; Fv is the maximum variable fluorescence yield; C(t) (0≤C(t)≤1) is the proportion of closed reaction centers. The photosynthetic fluorescence parameters Fo, Fm, Fv/Fm, σPSⅡ can be obtained by fitting the measured chlorophyll fluorescence kinetic curve according to formula (2).
According to the bio-optical model, the electron transport rate of phytoplankton PSⅡ can be obtained by the product of light irradiance, light absorption efficiency and PSII photochemical quantum yield, as shown in formula (3).
The absorption efficiency of photosystem Ⅱ αPSⅡ can be normalized to the minimum fluorescence yield
Among them, kp, kf, kd are the rate constants of photochemical, fluorescence, and non-radiative decay. Therefore, the PSⅡ electron transport rate can be expressed as formula (5)
In the equation, E is the photon radiance, ϕ'PSⅡ is the photochemical quantum yield of PSⅡ under light adaptation, ϕPSⅡis the photochemical quantum yield under dark adaptation, where K is an instrument-specific constant, according to this equation, the phytoplankton primary productivity can be quickly estimated.
1.2.1 The response time of the instrument
The response time is the interval between the initial and 95% of the first stable value measured by an instrument. The mean of the 10 response times is taken as the response time of the developed instrument. The result shows that the response time of the presented instrument is only 1.6 min while that of traditional laboratory analysis methods often exceeds 12 hours. The measurement resolution of the instrument largely depends on the response time. So the presented instrument can be used to realize the measurement of phytoplankton primary productivity in a large offshore aquatic ecosystem with high measurement resolution.
1.2.2 Precision analysis
According to the 10 repeated measurement data of phytoplankton primary productivity, the relative standard deviation is calculated according to formula (6), and the maximum relative standard deviation characterizes the instrument precision (RSD).
In formula (6), n is the number of measurements, Pi is the i-th measurement value, and
The marine Dunaliella salina cultured in the laboratory was selected as the experimental sample, and five samples of Dunaliella salina with chlorophyll concentrations 0.1, 0.5, 1, 5 and 10 μg·L-1 were configured. The instrument was used to measure the primary productivity of Dunaliella salina under the light intensity of 100, 200, 400, 600 and 800 μmol·m-2·s-1. The relative standard deviation of the measurement results of each sample is calculated according to Formula (6), and the measurement results show that the relative standard deviations of the phytoplankton primary productivity of the five samples under different light intensities are all lower than 4.86%.
1.2.3 Comparative analysis of electron transport rate and oxygen evolution rate
The liquid-phase oxygen electrode is widely used to measure plants’ photosynthesis efficiency. In this comparative experiment, Dunaliella salina was selected as the research object. The electron transport rate measured by the developed instrument and the photosynthetic oxygen evolution rate measured by the liquid-phase oxygen electrode (Hansatech Instruments, King’s Lynn, UK) was compared.
Culture aliquots of 5 mL were put into the test tube of this instrument, the electron transport rate of the sample was measured under the conditions of ambient light 0~600 μmol·m-2·s-1 at 20 ℃. The liquid-phase oxygen electrode system requires high sample concentration, culture aliquots of 100 mL were gravity-filtered through 47 mm GF/F filters and gently resuspended into 5 mL of the sample to pre-concentrate samples to 1.8~2.3 mg chl a L-1. A magnetic stirrer was used to ensure that the algae were evenly distributed. The photosynthetic oxygen evolution rate synchronization test was performed under ambient light 0~600 μmol·m-2·s-1 at 20 ℃. The relationship between the photosynthetic electron transport Pe and the photosynthetic oxygen evolution rate PO2 of Dunaliella salina is shown in Figure 4 below.
Figure 4 showed that the photosynthetic electron transport rate and photosynthetic oxygen evolution rate curves of Dunaliella salina under gradient culture light (0~600 μmol·m-2·s-1) had a good consistency, and the correlation coefficient between Pe and PO2 was 0.991. Both of them gradually increase with the increase of light. When the culture light reached 400 μmol·m-2·s-1, the upward trend of Pe and PO2 started to slow down and gradually become saturated, which was mainly due to the photoinhibition caused by too strong light, thereby slowing down the efficiency of photosynthesis.
![]()
Figure 4.Comparison of photosynthetic electron transport rate and photosynthetic oxygen evolution rate curves of Dunaliella salina under different culture light
2 Instrument field measurement and analysis
2.1 Underway measurement of phytoplankton primary productivity
High-frequency measurement of phytoplankton primary productivity was conducted in the Yellow Sea and the Bohai Sea during the autumn of 2019 (between 15th August and 26th August). The developed instrument was equipped on the China Marine Surveillance 101 experimental ship. The ship departed from Qingdao Nanjiang Wharf (36.10°N, 120.54°E) at 7:00 on August 18, 2019, arrived at Bohai Inner Bay (38.89°N, 119.48°E) at 19:00 on August 19, and then turned from the Bohai Sea back to Qingdao. On the way back, 10 sites were selected on the coast of the Yellow Sea for the in situ vertical profiles measurement of phytoplankton primary productivity. The cruise route in the Yellow Sea and the Bohai Sea during the investigation is shown in Figure 5.
![]()
Figure 5.The trajectory of the scientific research ship
The developed instrument was fixed in the cylindrical frame structure, and the frame was placed in a seawater tank on the ship, the seawater is continuously cramped in the seawater tank during the cruise. The measurement period of the instrument was set up to 10 minutes. The instrument was connected to a 24V power supply and a computer through a cable to achieve instrument power supply, data acquisition and analysis.
During the cruise, the phytoplankton primary productivity in different positions of the sea was measured. The spatial distribution of phytoplankton primary productivity in the Yellow Sea and the Bohai Sea is shown in Figure 6.
![]()
Figure 6.The spatial distribution of phytoplankton primary productivity in the Yellow Sea and the Bohai Sea
In Figure 6, we observe significant differences in phytoplankton primary productivity in the Yellow Sea and Bohai Sea. High-value areas of phytoplankton primary productivity appear in the southern of Yuetuo Island and around Changdao Scenic Area in Bohai Bay, which is significantly higher than the primary productivity along the coast of the Yellow Sea. The primary productivity in Bohai Bay is 1.1~1.4 times higher than the area outside the bay. There are more than 40 rivers along the coast of the Bohai Sea. River water injection and surface runoff have brought nutrients to the Bohai Sea. In addition, due to the impact of land-based pollution emissions in recent years, a large amount of phosphorus, nitrogen, and potassium nutrients flowed into the Bohai Sea, leading to eutrophication in the inner bay, which is the main reason for the high phytoplankton primary productivity in the Bohai Bay.
2.2 Vertical profiles measurement of phytoplankton primary productivity
The phytoplankton primary productivity in different water layers was investigated at 10 sites located in the Yellow Sea. During the vertical profiles measurement, the instrument was lowered into the different depths of seawater at a constant speed through the winch on the ship. At the same time, The photosynthetic radiation sensor coming with the instrument was used to record the solar irradiance. The trends of phyto-plankton primary productivity were recorded at different depths of 10 sites were shown in Figure 7(a).
![]()
Figure 7.Phytoplankton Primary productivity and chlorophyll concentration in different water layers of 10 sites
(a): Phytoplankton primary productivity; (b): Chlorophyll concentration
In Figure 7(a), it shows a depth-dependent response of phytoplankton primary productivity on each site in the Yellow sea. With the depth increases, the phytoplankton primary productivity at the 10 sites all show a gradual decline. At the same time, the corresponding solar irradiance drops from 1 500 μmol·m-2·s-1 near the sea surface to 300 μmol·m-2·s-1 at a depth of 12 meters. The negative correlation between the phytoplankton primary productivity and depth is likely attributable to the temperature and light environment changes in vertical profiles. Cause with the depth increased, the absorption of light energy by water and the scattering of suspended particles in seawater gradually increased, all these phenomena lead to a gradual decrease in the available light energy of phytoplankton, and the productivity of phytoplankton decreases with depth.
The phytoplankton primary productivity in the 10 sites is not consistent in the Yellow Sea. The primary productivity in site 2 and site 8 are significantly higher than that of other sites. Figure 7(b) shows the chlorophyll concentration on the surface of 10 sites, obtained by collecting and analyzing the surface water of the 10 sites. We observe that there are high chlorophyll values at site 2 and site 8. This is consistent with the measurement results of primary phytoplankton productivity. The difference in phytoplankton biomass in different sea areas is the main reason for the change of phytoplankton primary productivity.
3 Conclusion
In this work, a fast measuring instrument for phytoplankton primary productivity was designed based on the principle of chlorophyll fluorescence kinetics and the rapid and in field survey of phytoplankton primary productivity in the Yellow Sea and the Bohai Sea was presented. Be equipped on The China Marine Surveillance 101 experimental ship, the spatial distribution and vertical profiles of phytoplankton primary productivity in the Bohai Sea and the Yellow Sea were investigated. Nutrients, light, and biomass are the main reasons for the differences in the distribution of phytoplankton in the sea. The instrument had stable working performance and high measurement efficiency. It could meet the needs of fast and in situ measurement of the phytoplankton primary productivity in the aquatic ecosystem. It provided a new method for the rapid measurement of primary productivity in coastal waters.
References
[1] G Falkowski P, J Oliver M. Nature Reviews Microbiology, 5, 813(2007).
[2] A Dijkam N, C Kromkamp J, J Peene et al. European Journal of Phycology, 43, 327(2008).
[3] T Dalsgaard, K Hancke, K Sejr M et al. PLOS ONE, 10(2015).
[4] T Fujiki, T Hosaka, H Kimoto et al. Marine Ecosystem Progress Series, 353, 81(2008).
[5] R Arrigo K, S Pabi, G van Dijken. Geophysical Research Letters, 35(2008).
[6] G Falkowski P, Z Kolber. Limnology and Oceanography, 38, 1646(1993).
[7] G Falkowski P, S Kolber Z, O Prasil. Biochimica et Biophysica Acta-Bioenergetics, 1367, 88(1998).
[8] A Laws E, Y Xie Y, L Yang et al. Frontiers in Microbiology, 9, 1589(2018).
[9] E Houliez, S Nenonen, S Simis et al. Journal of Marine Systems, 169, 40(2017).
[10] R Abbott M, G Corno, M Letelier R et al. Journal of Phycology, 42, 51(2006).
[11] Jian Li, Jun-sheng WANG, Wen-hai XU et al. Opto-Electronic Engineering, 34, 118(2007).
[12] Chao-yi SHI, Gao-fang YIN, Yu-Jun ZHANG et al. Acta Photonica Sinica, 44, 217002-3(2015).
[13] Chao-yi SHI, Gao-fang YIN, Yu-Jun ZHANG et al. Laser & Optoelectronics Progress, 243(2016).
[14] J T Berry, E Weis. Biochim. Biophys. Acta, 894, 198(1987).
[15] G Falkowski P, Z Kolber, D Ziemann et al. Nature, 352, 55(1991).
[16] S Beer, M Bjork. Aquatic Botany, 66, 69(2000).
[17] M Kana T, L Macintyre H, J Suggett D et al. Aquatic Microbial Ecology, 56, 147(2009).
[18] M Moore C, K Oxborough, J Suggett D et al. Limnology and Oceanography: Methods, 10, 142(2012).


Set citation alerts for the article
Please enter your email address

© Copyright 2018-2021 | Chinese Laser Press. All Rights Reserved 沪ICP备15018463号-20