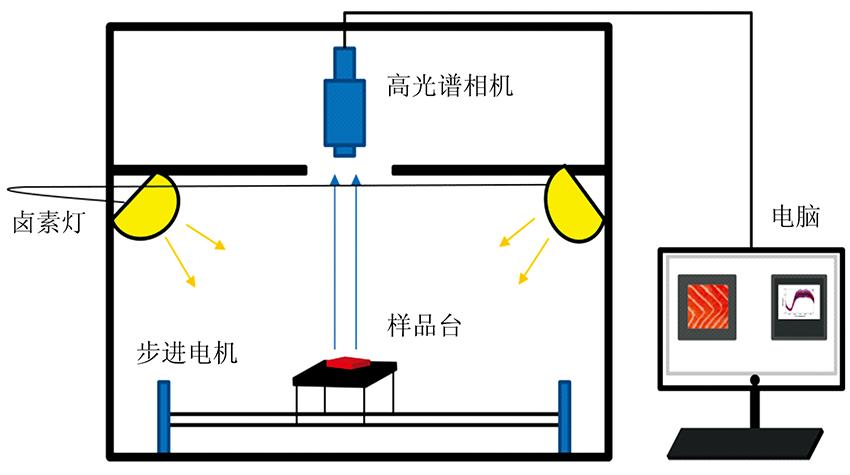
Fig. 1. Hyperspectral imaging system
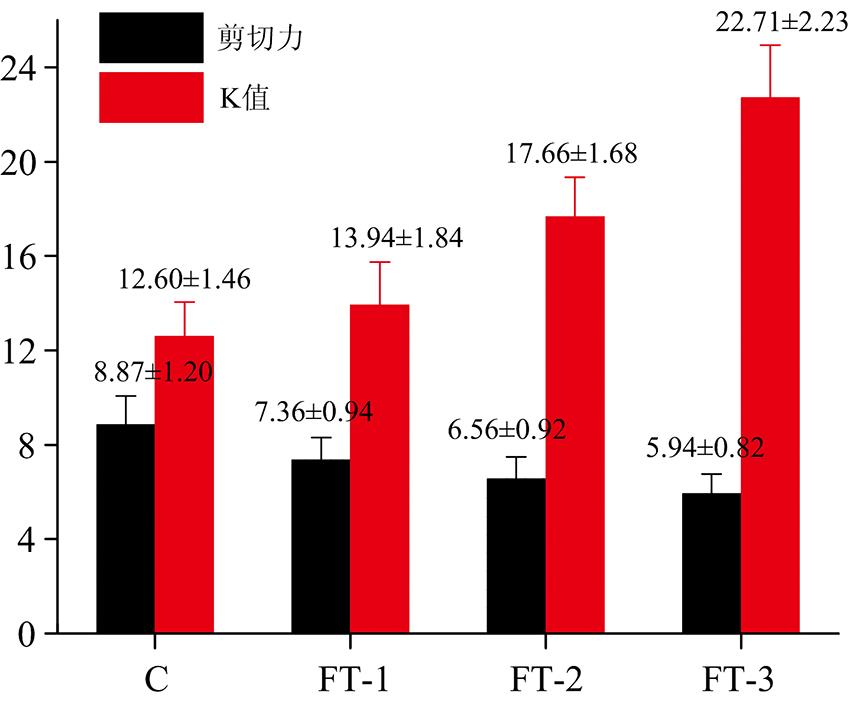
Fig. 2. Changes in shear force and K values of chilled and frozen-thawed salmon
Fig. 3. Wavelength interval positions selected by iVISSA for a*(a), shear force (b) and K value (c)
Fig. 4. The best prediction results of a* (a), shear force (b) and K value (c) obtained by CARS-PLS model
Fig. 5. The processes of CARS selecting characteristic variables related to a* (a), shear force (b) and K value (c)
Fig. 6. (A), (B), (C) are the visual distribution maps of a*, shear force, and K value, respectively, and (a), (b), (c), (d) represent group C, FT-1, FT-2, and FT-3
样品组 | L* | a* | b* |
---|
C | 53.66±2.72a | 16.96±0.96a | 17.64±0.65c | FT-1 | 52.61±2.53a | 15.24±0.80b | 18.01±1.19bc | FT-2 | 48.63±2.99b | 14.42±0.97c | 18.41±0.82b | FT-3 | 48.10±2.13b | 12.09±0.48d | 18.92±0.65a |
|
Table 1. L*, a*, b* values of chilled and frozen-thawed salmon
品质指标 | 校正集 | 预测集 |
---|
含量范围 | 平均 值 | 标准 偏差 | 含量范围 | 平均 值 | 标准 偏差 |
---|
a* | 11.21~18.52 | 14.94 | 1.95 | 11.51~18.03 | 14.16 | 1.84 | 剪切力/N | 4.79~10.98 | 7.46 | 1.58 | 5.21~8.66 | 6.63 | 1.00 | K值 | 9.71~25.89 | 16.66 | 4.49 | 10.48~25.88 | 16.86 | 4.03 |
|
Table 2. Division results of calibration set and test set
品质 指标 | 预处理 方法 | Rc | RMSECV | Rp | RMSEP |
---|
a*值 | Raw | 0.914 1 | 0.94 | 0.865 6 | 1.23 | 1st Der | 0.926 9 | 0.72 | 0.913 5 | 1.00 | 2nd Der | 0.789 8 | 1.35 | 0.755 9 | 1.42 | MSC | 0.846 6 | 1.27 | 0.792 6 | 1.31 | SNVT | 0.761 7 | 1.42 | 0.707 6 | 1.43 | N | 0.919 9 | 0.89 | 0.852 5 | 1.20 | MC | 0.899 7 | 1.14 | 0.882 5 | 1.18 | 剪切力 | Raw | 0.862 6 | 0.69 N | 0.796 6 | 0.73 N | 1st Der | 0.851 6 | 0.73 N | 0.826 2 | 0.85 N | 2nd Der | 0.874 6 | 0.68 N | 0.842 1 | 0.82 N | MSC | 0.703 2 | 1.12 N | 0.569 2 | 1.55 N | SNVT | 0.767 4 | 1.02 N | 0.618 3 | 1.46 N | N | 0.713 0 | 1.04 N | 0.676 1 | 1.23 N | MC | 0.536 2 | 1.94 N | 0.478 9 | 2.02 N | K值 | Raw | 0.851 4 | 2.17 | 0.810 2 | 2.65 | 1st Der | 0.853 8 | 2.02 | 0.840 7 | 2.38 | 2nd Der | 0.859 3 | 1.94 | 0.774 2 | 2.83 | MSC | 0.860 4 | 1.93 | 0.831 2 | 2.45 | SNVT | 0.851 0 | 2.24 | 0.802 5 | 2.74 | N | 0.881 7 | 1.75 | 0.846 3 | 2.27 | MC | 0.852 6 | 2.13 | 0.823 1 | 2.54 |
|
Table 3. Prediction results of a*, shear force and K value based on full spectrum variables
品质指标 | 模型 | 变量数 | Rc | RMSECV | Rp | RMSEP |
---|
| CARS-PLS | 51 | 0.931 6 | 0.72 | 0.929 7 | 0.74 | a* | iVISSA-PLS | 217 | 0.906 6 | 0.80 | 0.888 3 | 0.99 | | iVISSA-CARS-PLS | 31 | 0.915 4 | 0.79 | 0.906 3 | 0.83 | | CARS-PLS | 61 | 0.892 1 | 0.67 N | 0.887 3 | 0.80 N | 剪切力 | iVISSA-PLS | 443 | 0.650 5 | 1.10 N | 0.644 4 | 1.22 N | | iVISSA-CARS-PLS | 38 | 0.885 3 | 0.69 N | 0.860 9 | 0.90 N | | CARS-PLS | 51 | 0.951 4 | 1.33 | 0.950 0 | 1.53 | K值 | iVISSA-PLS | 324 | 0.878 4 | 2.07 | 0.878 0 | 2.29 | | iVISSA-CARS-PLS | 31 | 0.950 7 | 1.35 | 0.940 4 | 1.56 |
|
Table 4. The model results of a*, shear force and K value prediction based on screened wavelength