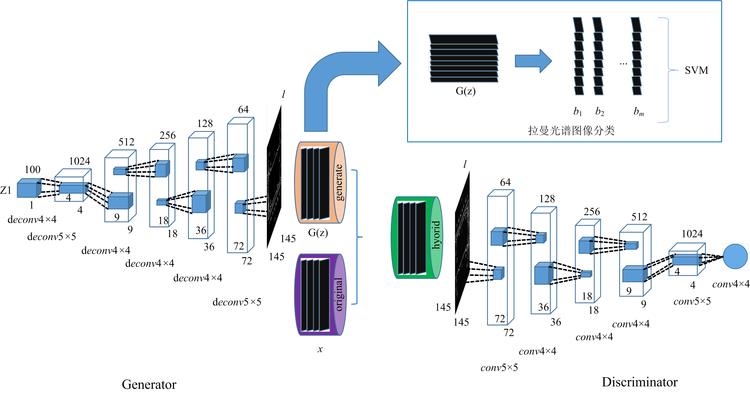
Fig. 1. Diagram of DCGAN network structure for Raman spectrum classification
Fig. 2. Spectral augmentation by slope-bias adjusting
Fig. 3. Spectral generation by data augmentation
Fig. 4. The original spectra (a) were compared with the generated spectra (b) of DCGAN
Fig. 5. Comparison of classification accuracy of training set and test set
| 网络层 | 设置参数 |
|---|
| INPUT | 预处理后的拉曼光谱数据 | | Conv1 | Size: 1×5, stride: 1, ReLU | | Conv2 | Size: 1×5, stride: 1, ReLU | | Full Connected | Conv2的feature展开 | | OUTPUT | 9个输出神经元, 连接FC层 |
|
Table 1. CNN network design
| 生成网络 | 判别网络 |
|---|
| 网络层 | 卷积核 | stride | padding | 激活函数 | BN层 | 网络层 | 卷积核 | stride | padding | 激活函数 | BN层 | | deconv1 | 1×4 | 0 | 0 | ReLU | 是 | conv1 | 1×5 | 2 | 1 | LeakyReLU | 是 | | deconv2 | 1×5 | 2 | 1 | ReLU | 是 | conv2 | 1×4 | 2 | 1 | LeakyReLU | 是 | | deconv3 | 1×4 | 2 | 1 | ReLU | 是 | conv3 | 1×4 | 2 | 1 | LeakyReLU | 是 | | deconv4 | 1×4 | 2 | 1 | ReLU | 是 | conv4 | 1×4 | 2 | 1 | LeakyReLU | 是 | | deconv5 | 1×4 | 2 | 1 | ReLU | 是 | conv5 | 1×5 | 2 | 1 | LeakyReLU | 是 |
|
Table 2. Generator network and Discriminator network for Raman spectral augmentation
| 序号 | 药品类别 | 样本数目 |
|---|
| 1 | Gatifloxacin | 15 | | 2 | Lomefloxacin | 21 | | 3 | Norfloxacin | 15 | | 4 | Pefloxacin | 12 | | 5 | Cephradine | 18 | | 6 | Cefradline | 15 | | 7 | Cefixime | 9 | | 8 | Ceftazidime | 18 | | 9 | Cefdinir | 30 |
|
Table 3. Distribution of corresponding drugs in data set National Institute for Food and Drug Control
| 药品 | 训练集 | 测试集 |
|---|
| Gatifloxacin | 11 | 4 | | Lomefloxacin | 15 | 6 | | Norfloxacin | 11 | 4 | | Pefloxacin | 9 | 3 | | Cephradine | 13 | 5 | | Cefradline | 11 | 4 | | Cefixime | 7 | 2 | | Ceftazidime | 13 | 5 | | Cefdinir | 21 | 9 | | 总数 | 111 | 52 |
|
Table 4. The training set, test set distribution of drug samples
| 药品 | 分错数量 |
|---|
| 训练集 | 测试集 |
|---|
| Gatifloxacin | 5 | 3 | | Lomefloxacin | 4 | 2 | | Norfloxacin | 4 | 2 | | Pefloxacin | 7 | 3 | | Cephradine | 4 | 3 | | Cefradline | 5 | 3 | | Cefixime | 6 | 2 | | Ceftazidime | 4 | 4 | | Cefdinir | 2 | 3 | | 分类准确率 | 63.06(70/111) | 51.92(27/52) |
|
Table 5. Detailed results of Raman spectrum discrimination of China food and drug institute-SVM (%)
| 药品 | 分错数量 |
|---|
| 训练集 | 测试集 |
|---|
| Gatifloxacin | 3 | 2 | | Lomefloxacin | 2 | 1 | | Norfloxacin | 2 | 2 | | Pefloxacin | 4 | 2 | | Cephradine | 2 | 1 | | Cefradline | 3 | 2 | | Cefixime | 5 | 2 | | Ceftazidime | 2 | 1 | | Cefdinir | 1 | 0 | | 分类准确率 | 78.38(87/111) | 75.00(39/52) |
|
Table 6. Detailed results of Raman spectrum discrimination CNN (%)
| 药品 | 训练集 | 测试集 |
|---|
| Gatifloxacin | 70 | 30 | | Lomefloxacin | 70 | 30 | | Norfloxacin | 70 | 30 | | Pefloxacin | 70 | 30 | | Cephradine | 70 | 30 | | Cefradline | 70 | 30 | | Cefixime | 70 | 30 | | Ceftazidime | 70 | 30 | | Cefdinir | 70 | 30 | | 总数 | 630 | 270 |
|
Table 7. The training set, test set distribution of drug samples
| 药品 | 分错数量 |
|---|
| 训练集 | 测试集 |
|---|
| Gatifloxacin | 9 | 1 | | Lomefloxacin | 5 | 3 | | Norfloxacin | 8 | 2 | | Pefloxacin | 10 | 2 | | Cephradine | 4 | 2 | | Cefradline | 8 | 4 | | Cefixime | 7 | 1 | | Ceftazidime | 8 | 3 | | Cefdinir | 7 | 4 | | 分类准确率 | 89.52(564/630) | 91.85(248/270) |
|
Table 8. Detailed results of Raman spectrum discrimination of China food and drug institute-Data augmentation and CNN (%)
| 原始谱图(a) | 扩增谱图(b) |
|---|
| 24.56 | 31.24 | | 29.74 | | 30.18 | | 32.05 | | 31.77 | | 34.65 | | 28.47 | | 30.69 | | 29.69 | | 31.51 |
|
Table 9. LVE signal to noise ratio of augmented spectral by slope-bias adjusting (corresponding to Fig.3)
| 药品 | 分错数量 |
|---|
| 训练集 | 测试集 |
|---|
| Gatifloxacin | 3 | 1 | | Lomefloxacin | 4 | 0 | | Norfloxacin | 2 | 2 | | Pefloxacin | 3 | 0 | | Cephradine | 1 | 0 | | Cefradline | 3 | 0 | | Cefixime | 2 | 0 | | Ceftazidime | 3 | 0 | | Cefdinir | 2 | 1 | | 分类准确率 | 96.35 | 98.52 |
|
Table 10. Detailed results of Raman spectrum discrimination of DCGAN and CNN (%)
| 原始谱图(a) | 扩增谱图(b) |
|---|
| 27.67 | 29.28 | | 27.08 | 30.59 | | 28.65 | 31.63 | | 20.49 | 31.79 | | 29.01 | 32.02 | | 27.53 | 31.67 | | 20.65 | 29.28 | | 28.22 | 29.32 | | 21.56 | 30.37 | | 20.86 | 29.34 |
|
Table 11. LVE signal to noise ratio of augmented spectral by DCGAN (corresponding to Fig.4)