• Spectroscopy and Spectral Analysis
  • Vol. 41, Issue 10, 3214 (2021)
Jia-mao SANG* and Feng-nong CHEN*;
Author Affiliations
  • School of Automation, Hangzhou Dianzi University, Hangzhou 310018, China
  • show less
    DOI: 10.3964/j.issn.1000-0593(2021)10-3214-06 Cite this Article
    Jia-mao SANG, Feng-nong CHEN. Detection of Rice False Smut Grade Degree Based on the Rank Sum Test of Spectral Feature Points[J]. Spectroscopy and Spectral Analysis, 2021, 41(10): 3214 Copy Citation Text show less
    DJI Matrice 600 PRO
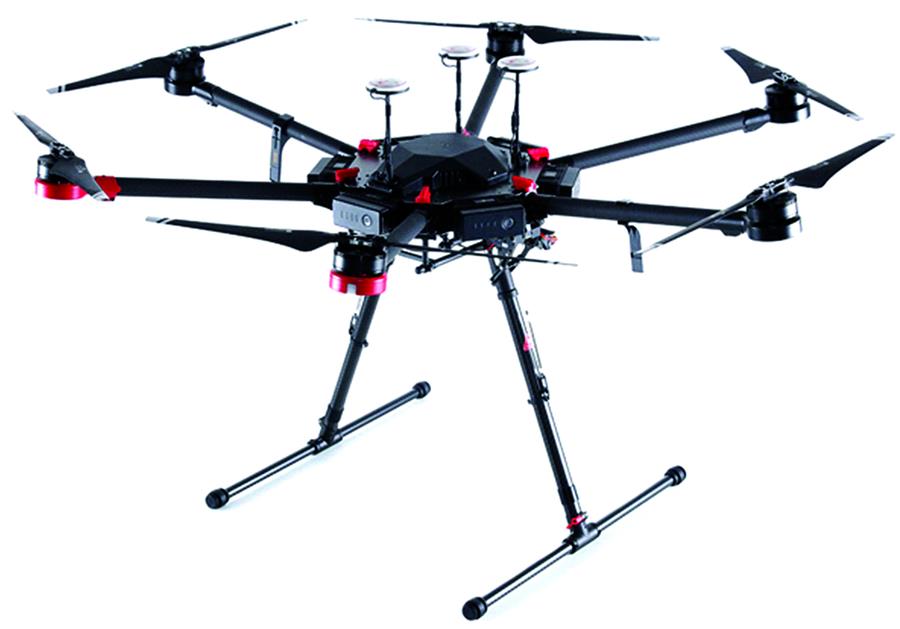
    Fig. 1. DJI Matrice 600 PRO
    Aerial photograph of Unmanned Aerial Vehicle (UAV) with hyperspectral device in test fieldNote: Figure 2 was collected on September 18, 2017; the rice is in the yellow ripening period; the climate is cloudy and there is no wind; the aerial photography route is from west to east.
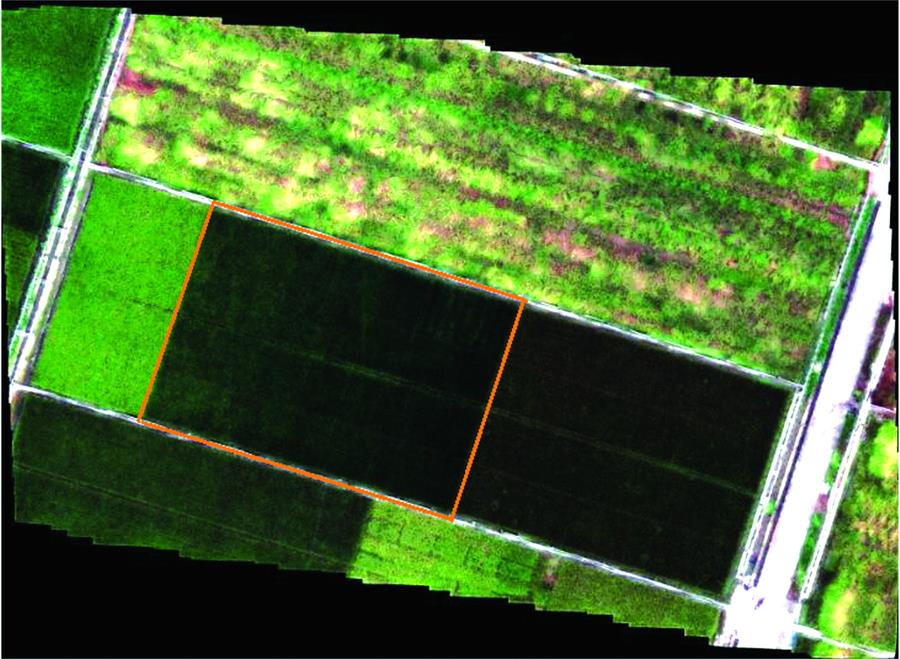
    Fig. 2. Aerial photograph of Unmanned Aerial Vehicle (UAV) with hyperspectral device in test field
    Note: Figure 2 was collected on September 18, 2017; the rice is in the yellow ripening period; the climate is cloudy and there is no wind; the aerial photography route is from west to east.
    Spectra of rice without rice smut diseaseand rice with rice smut disease
    Fig. 3. Spectra of rice without rice smut diseaseand rice with rice smut disease
    Technical route of rank sum test for rice smut disease
    Fig. 4. Technical route of rank sum test for rice smut disease
    Box drawing and notesNote: The horizontal lines from level 3 to level 5 from top to bottom represent the sample upper bound, upper 1/4 quintile, median line, lower 1/4 quintile, and sample lower bound.
    Fig. 5. Box drawing and notes
    Note: The horizontal lines from level 3 to level 5 from top to bottom represent the sample upper bound, upper 1/4 quintile, median line, lower 1/4 quintile, and sample lower bound.
    Diagram of the classification of Rice False Smut in experimental field
    Fig. 6. Diagram of the classification of Rice False Smut in experimental field
    种植日期
    第一期(06-15)ABCD
    第二期(06-20)ABCD
    第三期(06-25)ABCD
    第四期(06-30)ABCD
    第五期(07-5)ABCD
    第六期(07-10)ABCD
    第七期(07-15)ABCD
    Table 1. Planting distribution of rice test field in 2019
    水稻标号施辰子稻曲病发病等级划分法病情
    指数
    0级1级2级3级4级5级
    甬优十二 一期 A500000000
    甬优十二 一期 B500000000
    甬优十二 一期 C499100000.022
    甬优十二 一期 D498110000.089
    甬优十二 二期 A499001000.111
    甬优十二 二期 B498020000.133
    甬优十二 二期 C500000000
    甬优十二 二期 D499000000
    甬优十二 三期 A500000000
    甬优十二 三期 B498020000.133
    甬优十二 三期 C499010000.067
    甬优十二 三期 D498430000.286
    甬优十二 四期 A4691675211.889
    甬优十二 四期 B4821024201.111
    甬优十二 四期 C4741662201.289
    甬优十二 四期 D4691675211.889
    甬优十二 五期 A4811016201.267
    甬优十二 五期 B433322014134.330
    甬优十二 五期 C423241915865.971
    甬优十二 五期 D363592724131410.6
    甬优十二 六期 A5601998512.399
    甬优十二 六期 B51519169212.669
    甬优十二 六期 C51312108402.234
    甬优十二 六期 D19110210404.813
    甬优十二 七期 A431692324246.188
    甬优十二 七期 B373593340111211.43
    甬优十二 七期 C42945915213.770
    甬优十二 七期D129418134913.017
    Table 2. Disease grade of Rice False Smutin different experimental areas
    方差
    来源
    平方和自由度均方差卡方
    统计量
    p
    组间1.259 48×10911.259 48×10937.787.908 71×10-10
    组内6.654 07×101119 9983.327 37×107--
    总计6.666 67×101119 999---
    Table 3. Output of rank sum test
    参与检验的等级p
    1, 33.8×10⁻⁹
    1, 54.2×10⁻¹¹
    1, 75.6×10⁻⁷
    3, 57.9×10⁻¹⁰
    3, 74.6×10⁻⁶
    5, 73.9×10⁻⁹
    1, 3, 55.2×10⁻⁸
    1, 3, 78.7×10⁻¹⁰
    1, 5, 76.9×10⁻⁷
    3, 5, 73.5×10⁻¹¹
    1, 3, 5, 77.3×10⁻⁹
    Table 4. Significance rank sum test results
    Jia-mao SANG, Feng-nong CHEN. Detection of Rice False Smut Grade Degree Based on the Rank Sum Test of Spectral Feature Points[J]. Spectroscopy and Spectral Analysis, 2021, 41(10): 3214
    Download Citation