• Photonics Research
  • Vol. 8, Issue 10, 1580 (2020)
Yuwei Zhao1、†, Jintao Fan2、3、†, Youjian Song1、5、*, Uwe Morgner2、3、4, and Minglie Hu1、6、*
Author Affiliations
  • 1Ultrafast Laser Laboratory, Key Laboratory of Opto-electronic Information Science and Technology of Ministry of Education, School of Precision Instruments and Opto-electronics Engineering, Tianjin University, Tianjin 300072, China
  • 2Institut für Quantenoptik, Leibniz Universität Hannover, Welfengarten 1, 30167 Hannover, Germany
  • 3Cluster of Excellence PhoenixD (Photonics, Optics, and Engineering-Innovation Across Disciplines), 30167 Hannover, Germany
  • 4Laser Zentrum Hannover e.V., Hollerithallee 8, 30419 Hannover, Germany
  • 5e-mail: yjsong@tju.edu.cn
  • 6e-mail: huminglie@tju.edu.cn
  • show less
    DOI: 10.1364/PRJ.398316 Cite this Article Set citation alerts
    Yuwei Zhao, Jintao Fan, Youjian Song, Uwe Morgner, Minglie Hu. Extraction of internal phase motions in femtosecond soliton molecules using an orbital-angular-momentum-resolved method[J]. Photonics Research, 2020, 8(10): 1580 Copy Citation Text show less
    Experimental setup. AC, autocorrelator; BS, beam splitter; PBS, polarization beam splitter; QWP, quarter-wave plate; VWP, vortex wave plate. The inset shows the diagram of a twin-pulse molecule.
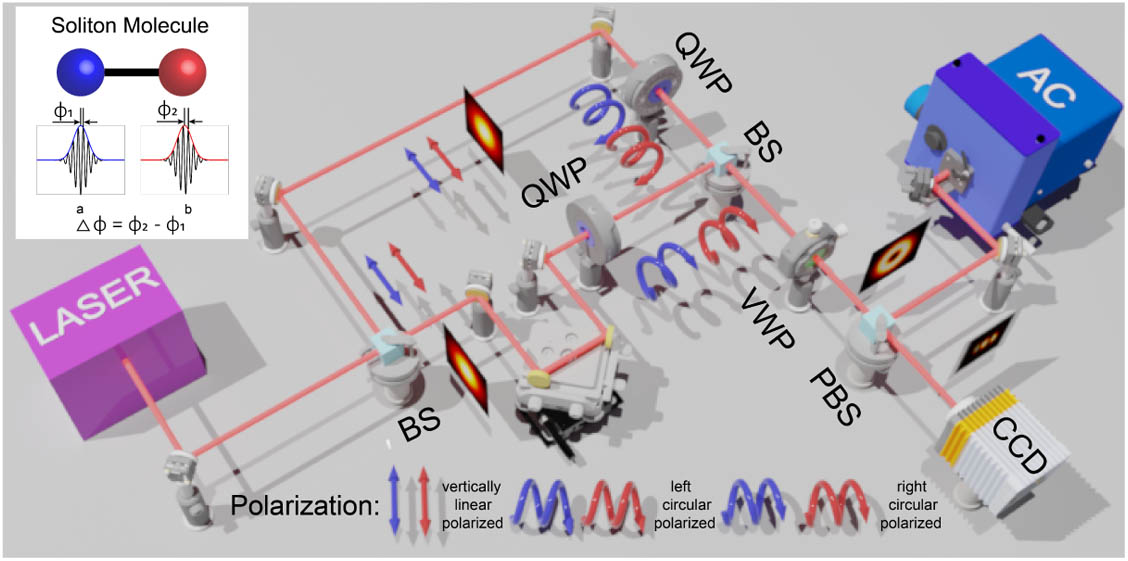
    Fig. 1. Experimental setup. AC, autocorrelator; BS, beam splitter; PBS, polarization beam splitter; QWP, quarter-wave plate; VWP, vortex wave plate. The inset shows the diagram of a twin-pulse molecule.
    Principle of the OAM-resolved method. (a) Interference pattern created by two optical vortices with topological charges l1=1 and l2=−1; (b), (c) temporal and spectral properties of a simulated soliton molecule; (d) simulated spectral evolution over 500 round-trips in consideration of linear relative phase evolution; (e) the phase evolution retrieved from (d) and the corresponding interferometric patterns. Arrows are used to indicate the polarization distributions in each case. The lobes present the results measured behind a horizontal polarizer.
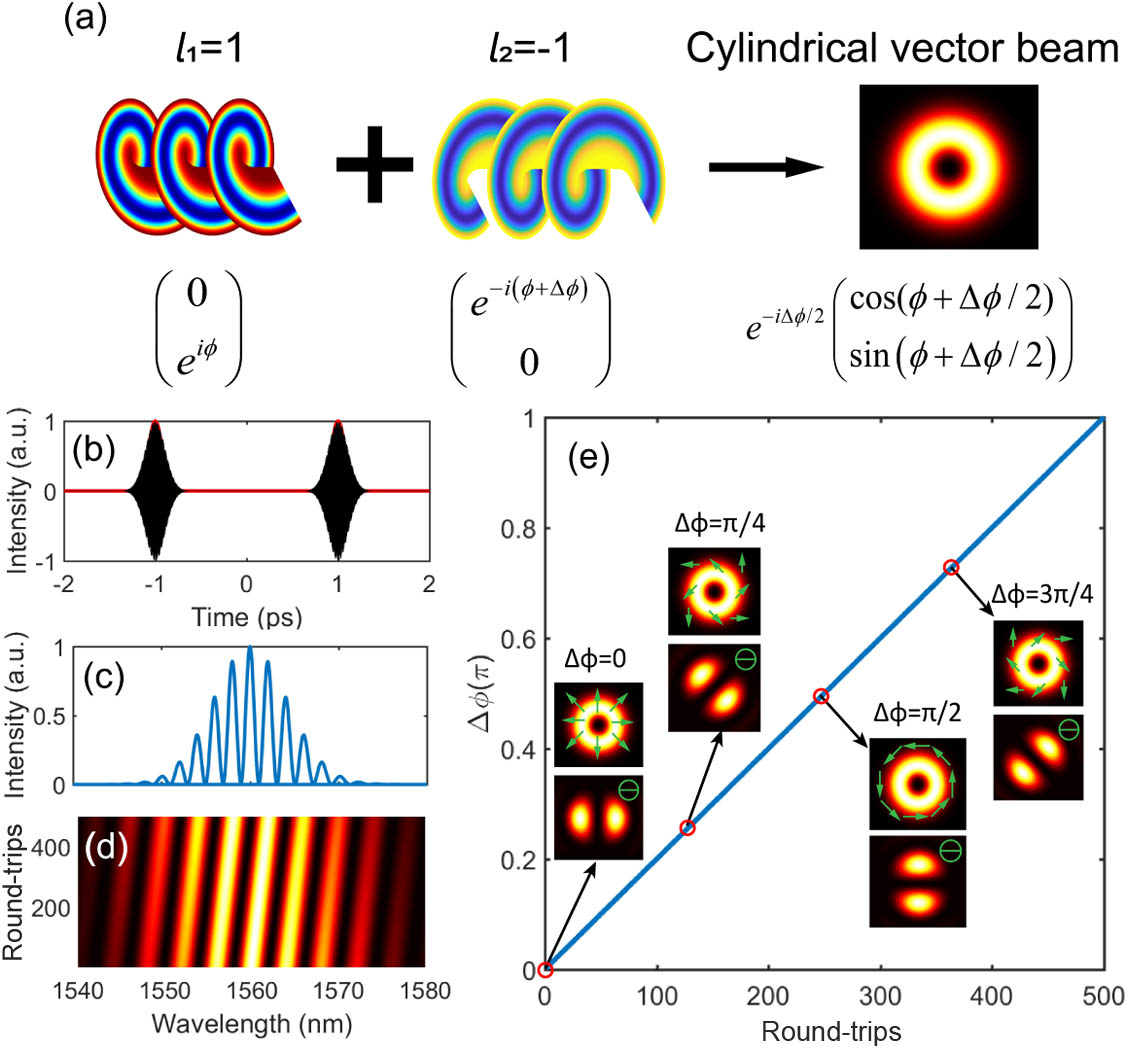
    Fig. 2. Principle of the OAM-resolved method. (a) Interference pattern created by two optical vortices with topological charges l1=1 and l2=1; (b), (c) temporal and spectral properties of a simulated soliton molecule; (d) simulated spectral evolution over 500 round-trips in consideration of linear relative phase evolution; (e) the phase evolution retrieved from (d) and the corresponding interferometric patterns. Arrows are used to indicate the polarization distributions in each case. The lobes present the results measured behind a horizontal polarizer.
    Stationary soliton molecule. (a) Spectrum of the twin-soliton molecule, (b) spectral evolution over 10 min, (c) relative phase evolution of two soliton pulses within the soliton pairs within 400 s. The insets show the interferometric patterns after PBS.
    Fig. 3. Stationary soliton molecule. (a) Spectrum of the twin-soliton molecule, (b) spectral evolution over 10 min, (c) relative phase evolution of two soliton pulses within the soliton pairs within 400 s. The insets show the interferometric patterns after PBS.
    Soliton molecules with monotonically evolving phase difference. Recorded spectra over 10 min with different pulse separations of (a) 0.8 ps, (c) 1.4 ps, (e) 1.8 ps, and (g) 4 ps. (b), (d), (f), and (h) The corresponding relative phase dynamics versus time.
    Fig. 4. Soliton molecules with monotonically evolving phase difference. Recorded spectra over 10 min with different pulse separations of (a) 0.8 ps, (c) 1.4 ps, (e) 1.8 ps, and (g) 4 ps. (b), (d), (f), and (h) The corresponding relative phase dynamics versus time.
    Interferometric patterns recorded after PBS for different pulse separations of (a) 0.8 ps, (b) 1.4 ps, (c) 1.8 ps, and (d) 4 ps.
    Fig. 5. Interferometric patterns recorded after PBS for different pulse separations of (a) 0.8 ps, (b) 1.4 ps, (c) 1.8 ps, and (d) 4 ps.
    Relative phase evolution within a tri-soliton molecule. (a) Spectrum of the tri-soliton molecule, (b) spectral intensity variation during 10 min, (c) autocorrelation trace of the tri-soliton molecule, (d) relative phase evolution of θ12+θ23 and θ13 based on the OAM-resolved method.
    Fig. 6. Relative phase evolution within a tri-soliton molecule. (a) Spectrum of the tri-soliton molecule, (b) spectral intensity variation during 10 min, (c) autocorrelation trace of the tri-soliton molecule, (d) relative phase evolution of θ12+θ23 and θ13 based on the OAM-resolved method.
    Yuwei Zhao, Jintao Fan, Youjian Song, Uwe Morgner, Minglie Hu. Extraction of internal phase motions in femtosecond soliton molecules using an orbital-angular-momentum-resolved method[J]. Photonics Research, 2020, 8(10): 1580
    Download Citation