
Brian A. Ko, Alexei V. Sokolov, Marlan O. Scully, Zhenrong Zhang, Ho Wai Howard Lee, "Enhanced four-wave mixing process near the excitonic resonances of bulk MoS2," Photonics Res. 7, 251 (2019)
- Photonics Research
- Vol. 7, Issue 3, 251 (2019)
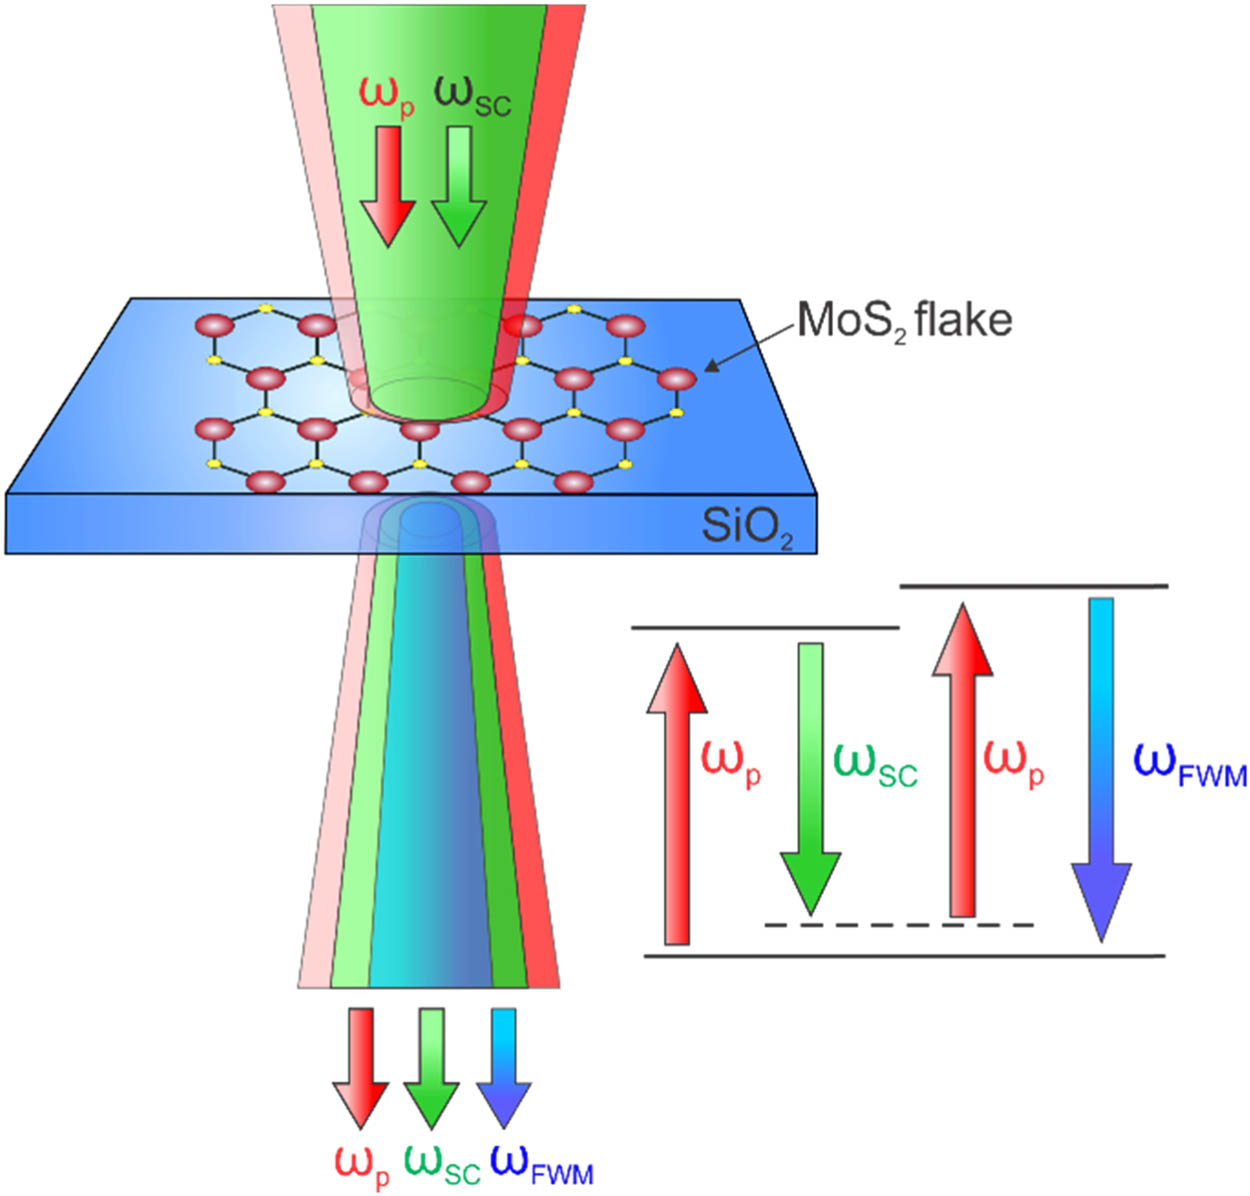
Fig. 1. Two pulses (ω p ω SC MoS 2 ω p ω SC ω FWM
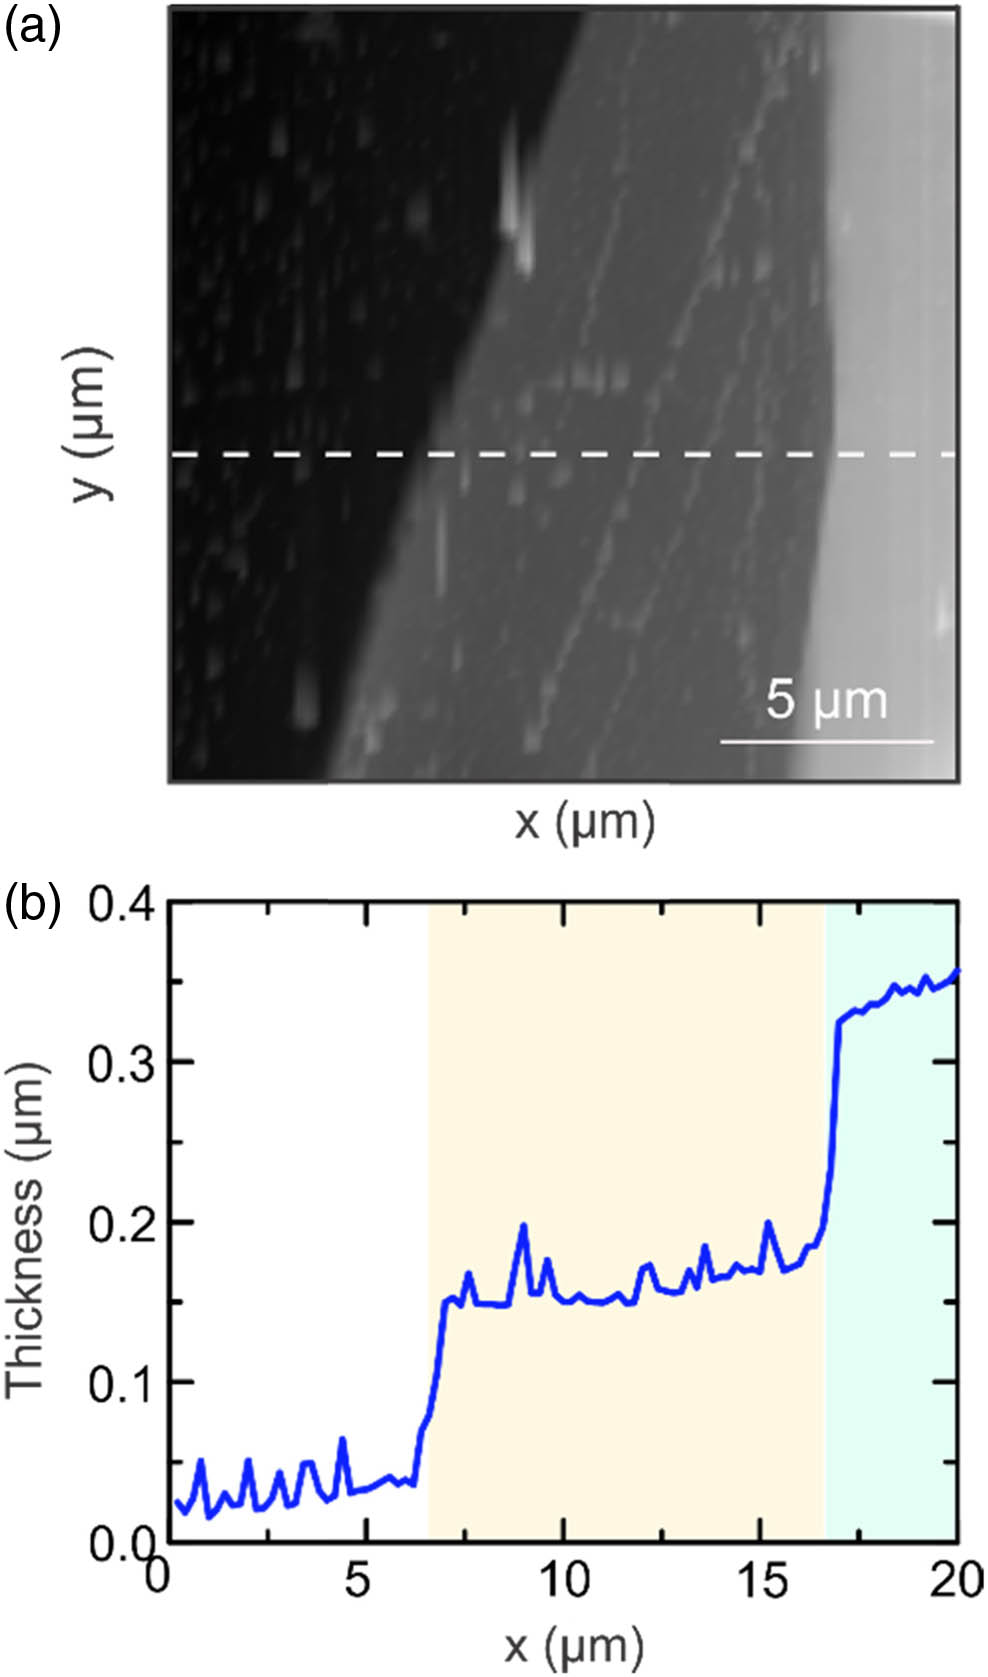
Fig. 2. (a) Atomic force microscope (AFM) image of the MoS 2 MoS 2
Fig. 3. Schematic of the multiplex femtosecond coherent anti-Stokes Raman spectroscopy setup. The laser provides 50 fs pulses with an 80 MHz repetition rate. RELP, razor-edge long-pass filter.
Fig. 4. (a) Optical microscope image of the MoS 2 MoS 2
Fig. 5. Photoluminescence intensity dependence for (a) pump and (b) supercontinuum pulses on the 290 nm section of the MoS 2 C .
Fig. 6. Four-wave mixing spectra of the MoS 2
Fig. 7. (a) Optical microscope image of the MoS 2
Fig. 8. Spectrum obtained at the two locations depicted in Fig. 4(a) by blocking individual pulses. Unblocked spectrum (both pulse trains) is shown in black, supercontinuum only (pump blocked) in blue, and pump only (supercontinuum blocked) in red.
Fig. 9. Spectra (solid lines) and fitted peaks (dashed lines) of the MoS 2
Fig. 10. Measured spectrum of the supercontinuum pulse incident on the (a) blue and (b) orange spots in Fig. 4(a) . Spectra were obtained by blocking the pump pulse and removing the short-pass filters that block the incident pulses. A neutral density filter was placed to prevent saturation while maintaining the spectral character.
Fig. 11. B excitonic resonance of MoS 2 4(a) (thickness of 290 nm). The energy of the B exciton corresponds to a wavelength of approximately 600 nm.


Set citation alerts for the article
Please enter your email address

© Copyright 2018-2021 | Chinese Laser Press. All Rights Reserved 沪ICP备15018463号-20