
Zhao PAN, Zong-liang LI, Zhen-wei ZHANG, Yin-tang WEN, Peng-yang ZHANG. Defect Detection and Analysis of Ceramic Fiber Composites Based on THz-TDS Technology[J]. Spectroscopy and Spectral Analysis, 2022, 42(5): 1547
- Spectroscopy and Spectral Analysis
- Vol. 42, Issue 5, 1547 (2022)
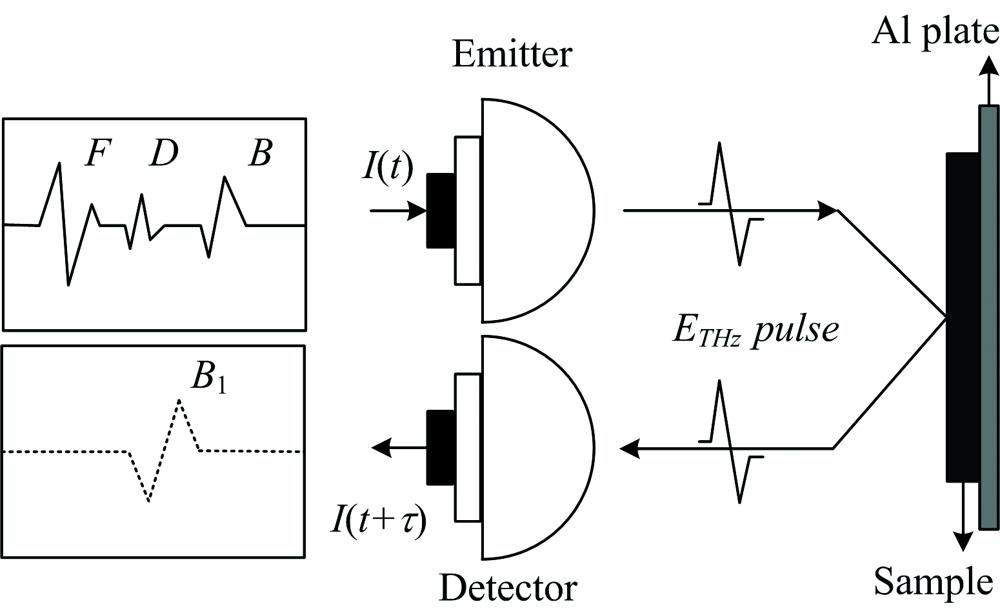
Fig. 1. Schematic diagram of THz time-domain spectrum detection
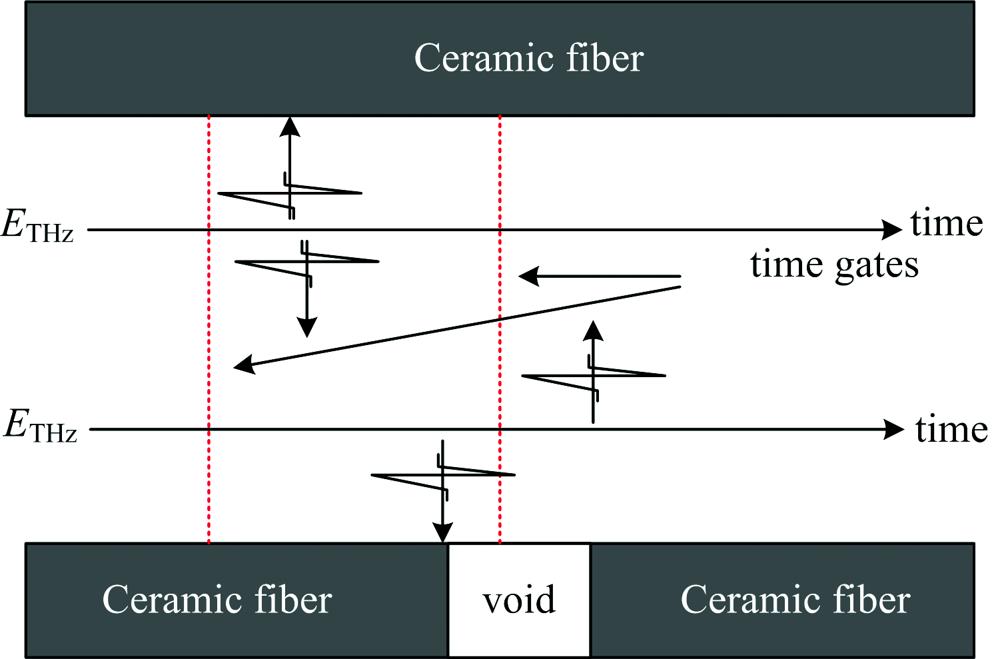
Fig. 2. Schematic diagram of terahertz wave transmission response
Fig. 3. Schematic of THz-TDS
Fig. 4. THz-TDS pulse spectrum imaging system schematic
Fig. 5. Design drawing of ceramic fiber composite sample
Fig. 6. Time-domain waveforms of debonding parts of ceramic matrix composites
(a): Original time domain signal; (b): Deconvolution filter processing time domain signal
(a): Original time domain signal; (b): Deconvolution filter processing time domain signal
Fig. 7. Time domain waveform corresponding to different media interfaces of the sample
(a): Bonding; (b): Debonding
(a): Bonding; (b): Debonding
Fig. 8. Slice diagram of tomography scanning
Fig. 9. Effect diagram of bilateral filtering
(a): Original image of terahertz scanning imaging;(b): Effect picture of bilateral filtering processingσ d=1.4, σ r=0.1
(a): Original image of terahertz scanning imaging;(b): Effect picture of bilateral filtering processing
Fig. 10. Refractive index curve of ceramic fiber composite
Fig. 11. Debonding tomography of ceramic matrix composites
(a):N -layer debonding imaging; (b): M -layer debonding imaging
(a):

Set citation alerts for the article
Please enter your email address
© Copyright 2018-2021 | Chinese Laser Press. All Rights Reserved 沪ICP备15018463号-20