
Song-jie GUO, Yue-ting ZHOU, Yong-qian WU, Xiao-bin ZHOU, Jian-fei TIAN, Gang ZHAO, Wei-guang MA, Lei DONG, Lei ZHANG, Wang-bao YIN, Lian-tuan XIAO, Suo-tang JIA. Experimental Study on Narrowing 632.8 nm External Cavity Diode Laser Linewidth Based on Self Made Ultra-Stable F-P Cavity[J]. Spectroscopy and Spectral Analysis, 2021, 41(2): 339
- Spectroscopy and Spectral Analysis
- Vol. 41, Issue 2, 339 (2021)
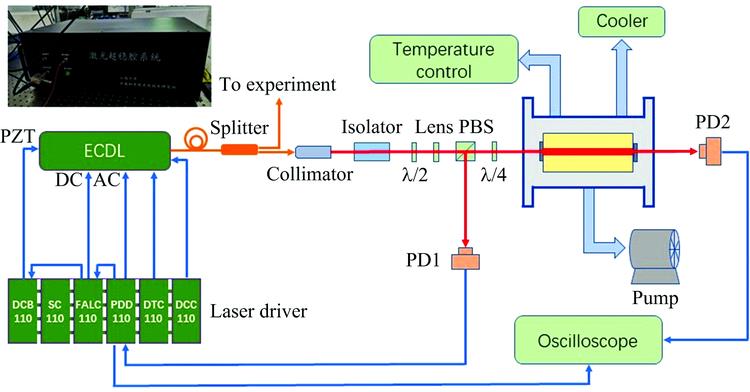
Fig. 1. Experimental setup of narrow linewidth laser
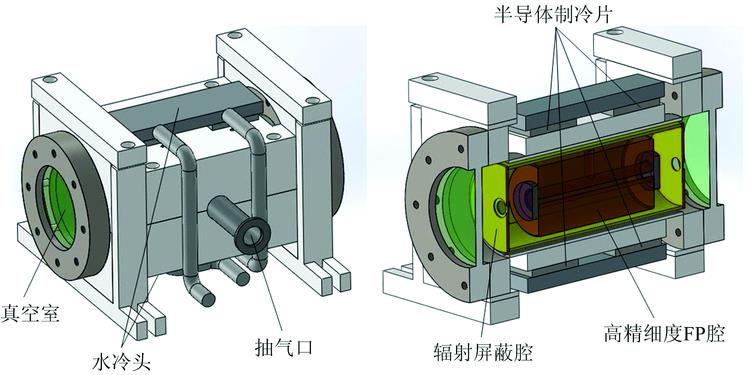
Fig. 2. Schematic diagram of super stable cavity mechanical mechanism
Fig. 3. Cavity transmission signal and error signal of scanning state (left) and locked state (right)
(a): Scan trigger signal; (b): Error signal in scanning state; (c): Cavity transmitted signal in scanning state; (d): Trigger signal in scan off; (e): Error signal in locked state; (f): Cavity transmitted signal in locked state
(a): Scan trigger signal; (b): Error signal in scanning state; (c): Cavity transmitted signal in scanning state; (d): Trigger signal in scan off; (e): Error signal in locked state; (f): Cavity transmitted signal in locked state
Fig. 4. Spectrum signal after frequency locking (left) and current feedback PID frequency response (right)
(a): Spectrum signal of cavity reflected light after frequency locking; (b) PID gain characteristic curve; (c): PID phase characteristic curve
(a): Spectrum signal of cavity reflected light after frequency locking; (b) PID gain characteristic curve; (c): PID phase characteristic curve
Fig. 5. Error signal acquisition in scanning and locking state
(a): Represents the error signal in the scanning state; (b): 20 s error signal after locking
(a): Represents the error signal in the scanning state; (b): 20 s error signal after locking
Fig. 6. Frequency distribution statistics of error signals after locking
Fig. 7. Frequency drift for 12 consecutive hours after frequency lock

Set citation alerts for the article
Please enter your email address
© Copyright 2018-2021 | Chinese Laser Press. All Rights Reserved 沪ICP备15018463号-20