• Chinese Journal of Lasers
  • Vol. 46, Issue 9, 907001 (2019)
Chen Ningbo1、2, Zhou Huichao2、3, Zhao Huangxuan2, Wang Boquan1、2, Song Liang2, Liu Chengbo2, and Zhang Jianhui1
Author Affiliations
  • 1School of Mechanical and Electrical Engineering, Guangzhou University, Guangzhou, Guangdong 510006, China
  • 2Research Lab for Biomedical Optics and Molecular Imaging, Shenzhen Institutes of Advanced Technology,Chinese Academy of Sciences, Shenzhen, Guangdong 518055, China
  • 3Department of Ultrasound, the Third Affiliated Hospital, Sun Yat-Sen University,Guangzhou, Guangdong 510630, China
  • show less
    DOI: 10.3788/CJL201946.0907001 Cite this Article Set citation alerts
    Chen Ningbo, Zhou Huichao, Zhao Huangxuan, Wang Boquan, Song Liang, Liu Chengbo, Zhang Jianhui. High-Resolution Photoacoustic Quantitative Imaging of Tumor Vessels[J]. Chinese Journal of Lasers, 2019, 46(9): 907001 Copy Citation Text show less
    Schematic of high-resolution photoacoustic microscopy imaging system
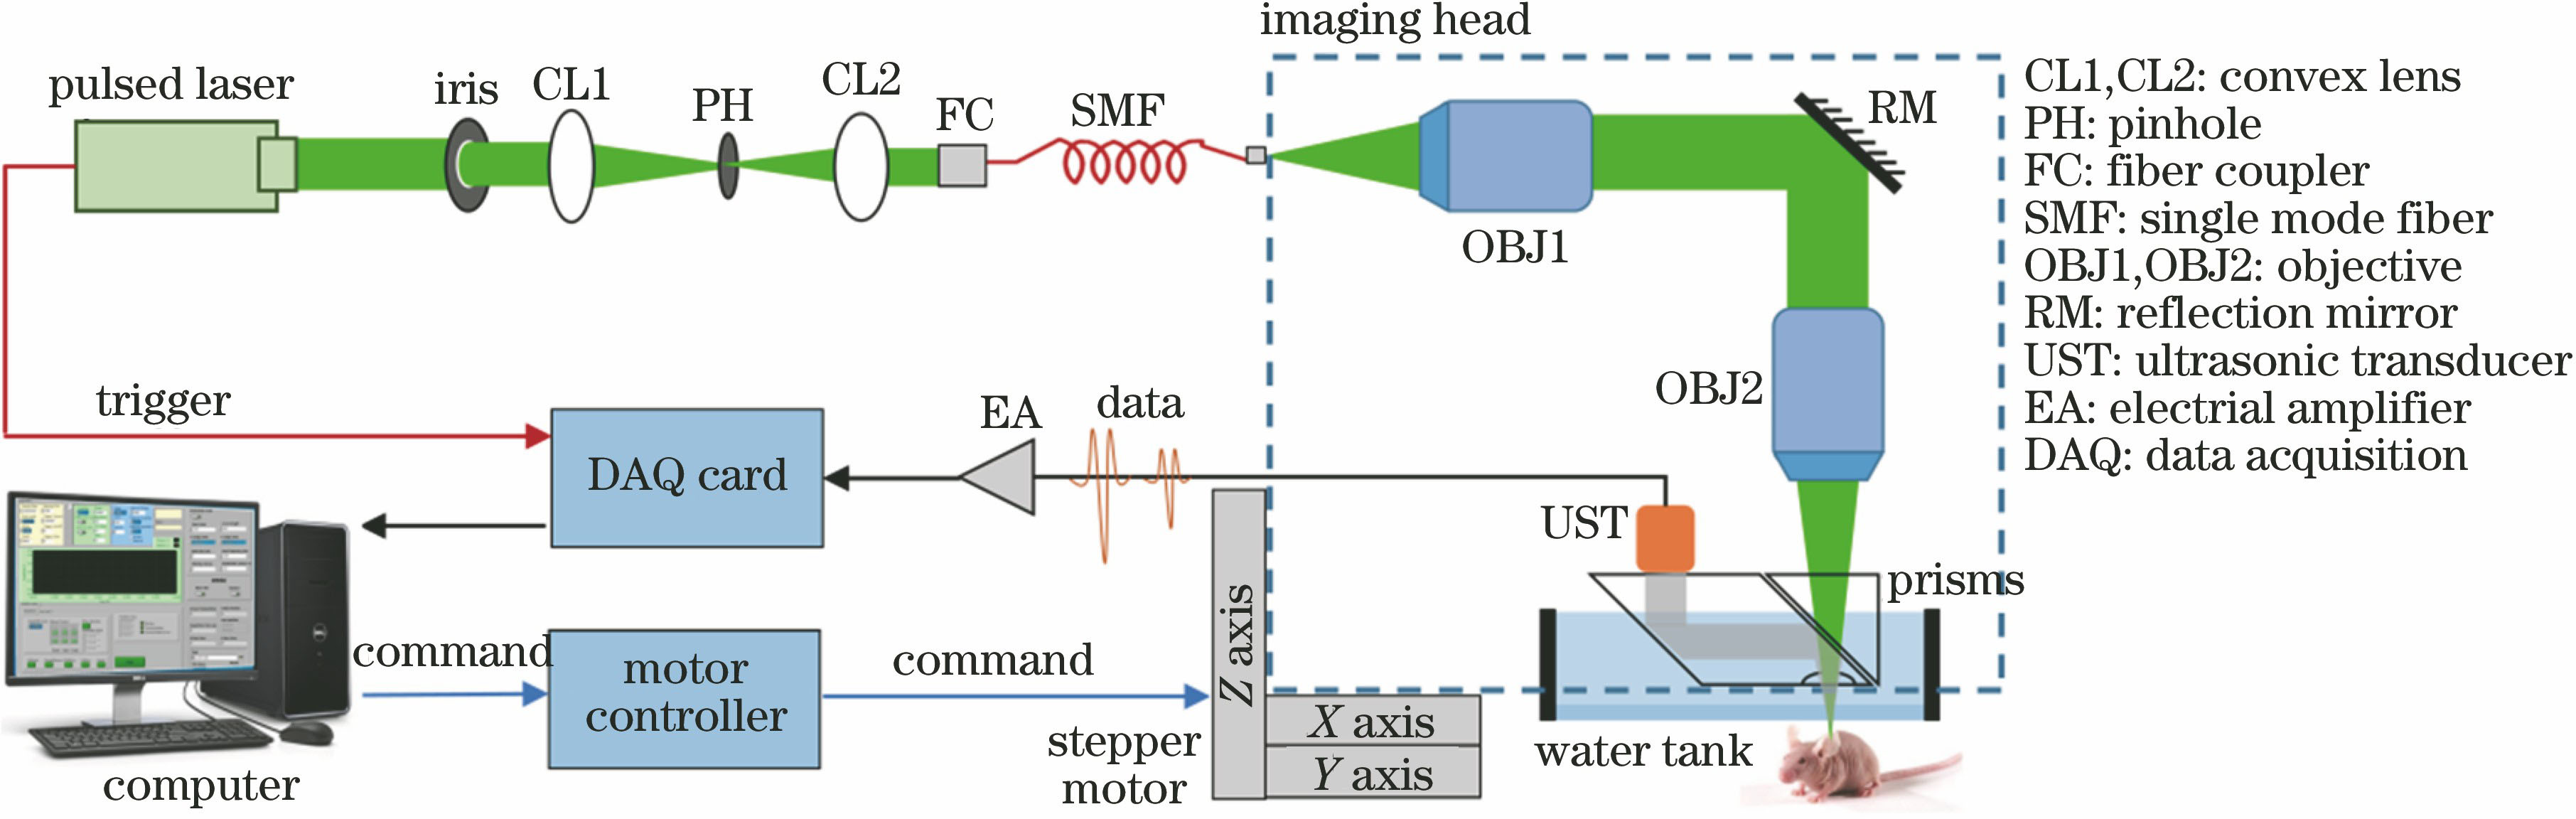
    Fig. 1. Schematic of high-resolution photoacoustic microscopy imaging system
    Spatial resolution test results of imaging system. (a) Fitted lateral profiles of blade edge; (b) photoacoustic MAP image of blade edge; (c) Gaussian-fitted axial profile of single carbon fiber; (d) MAP image of carbon fibers
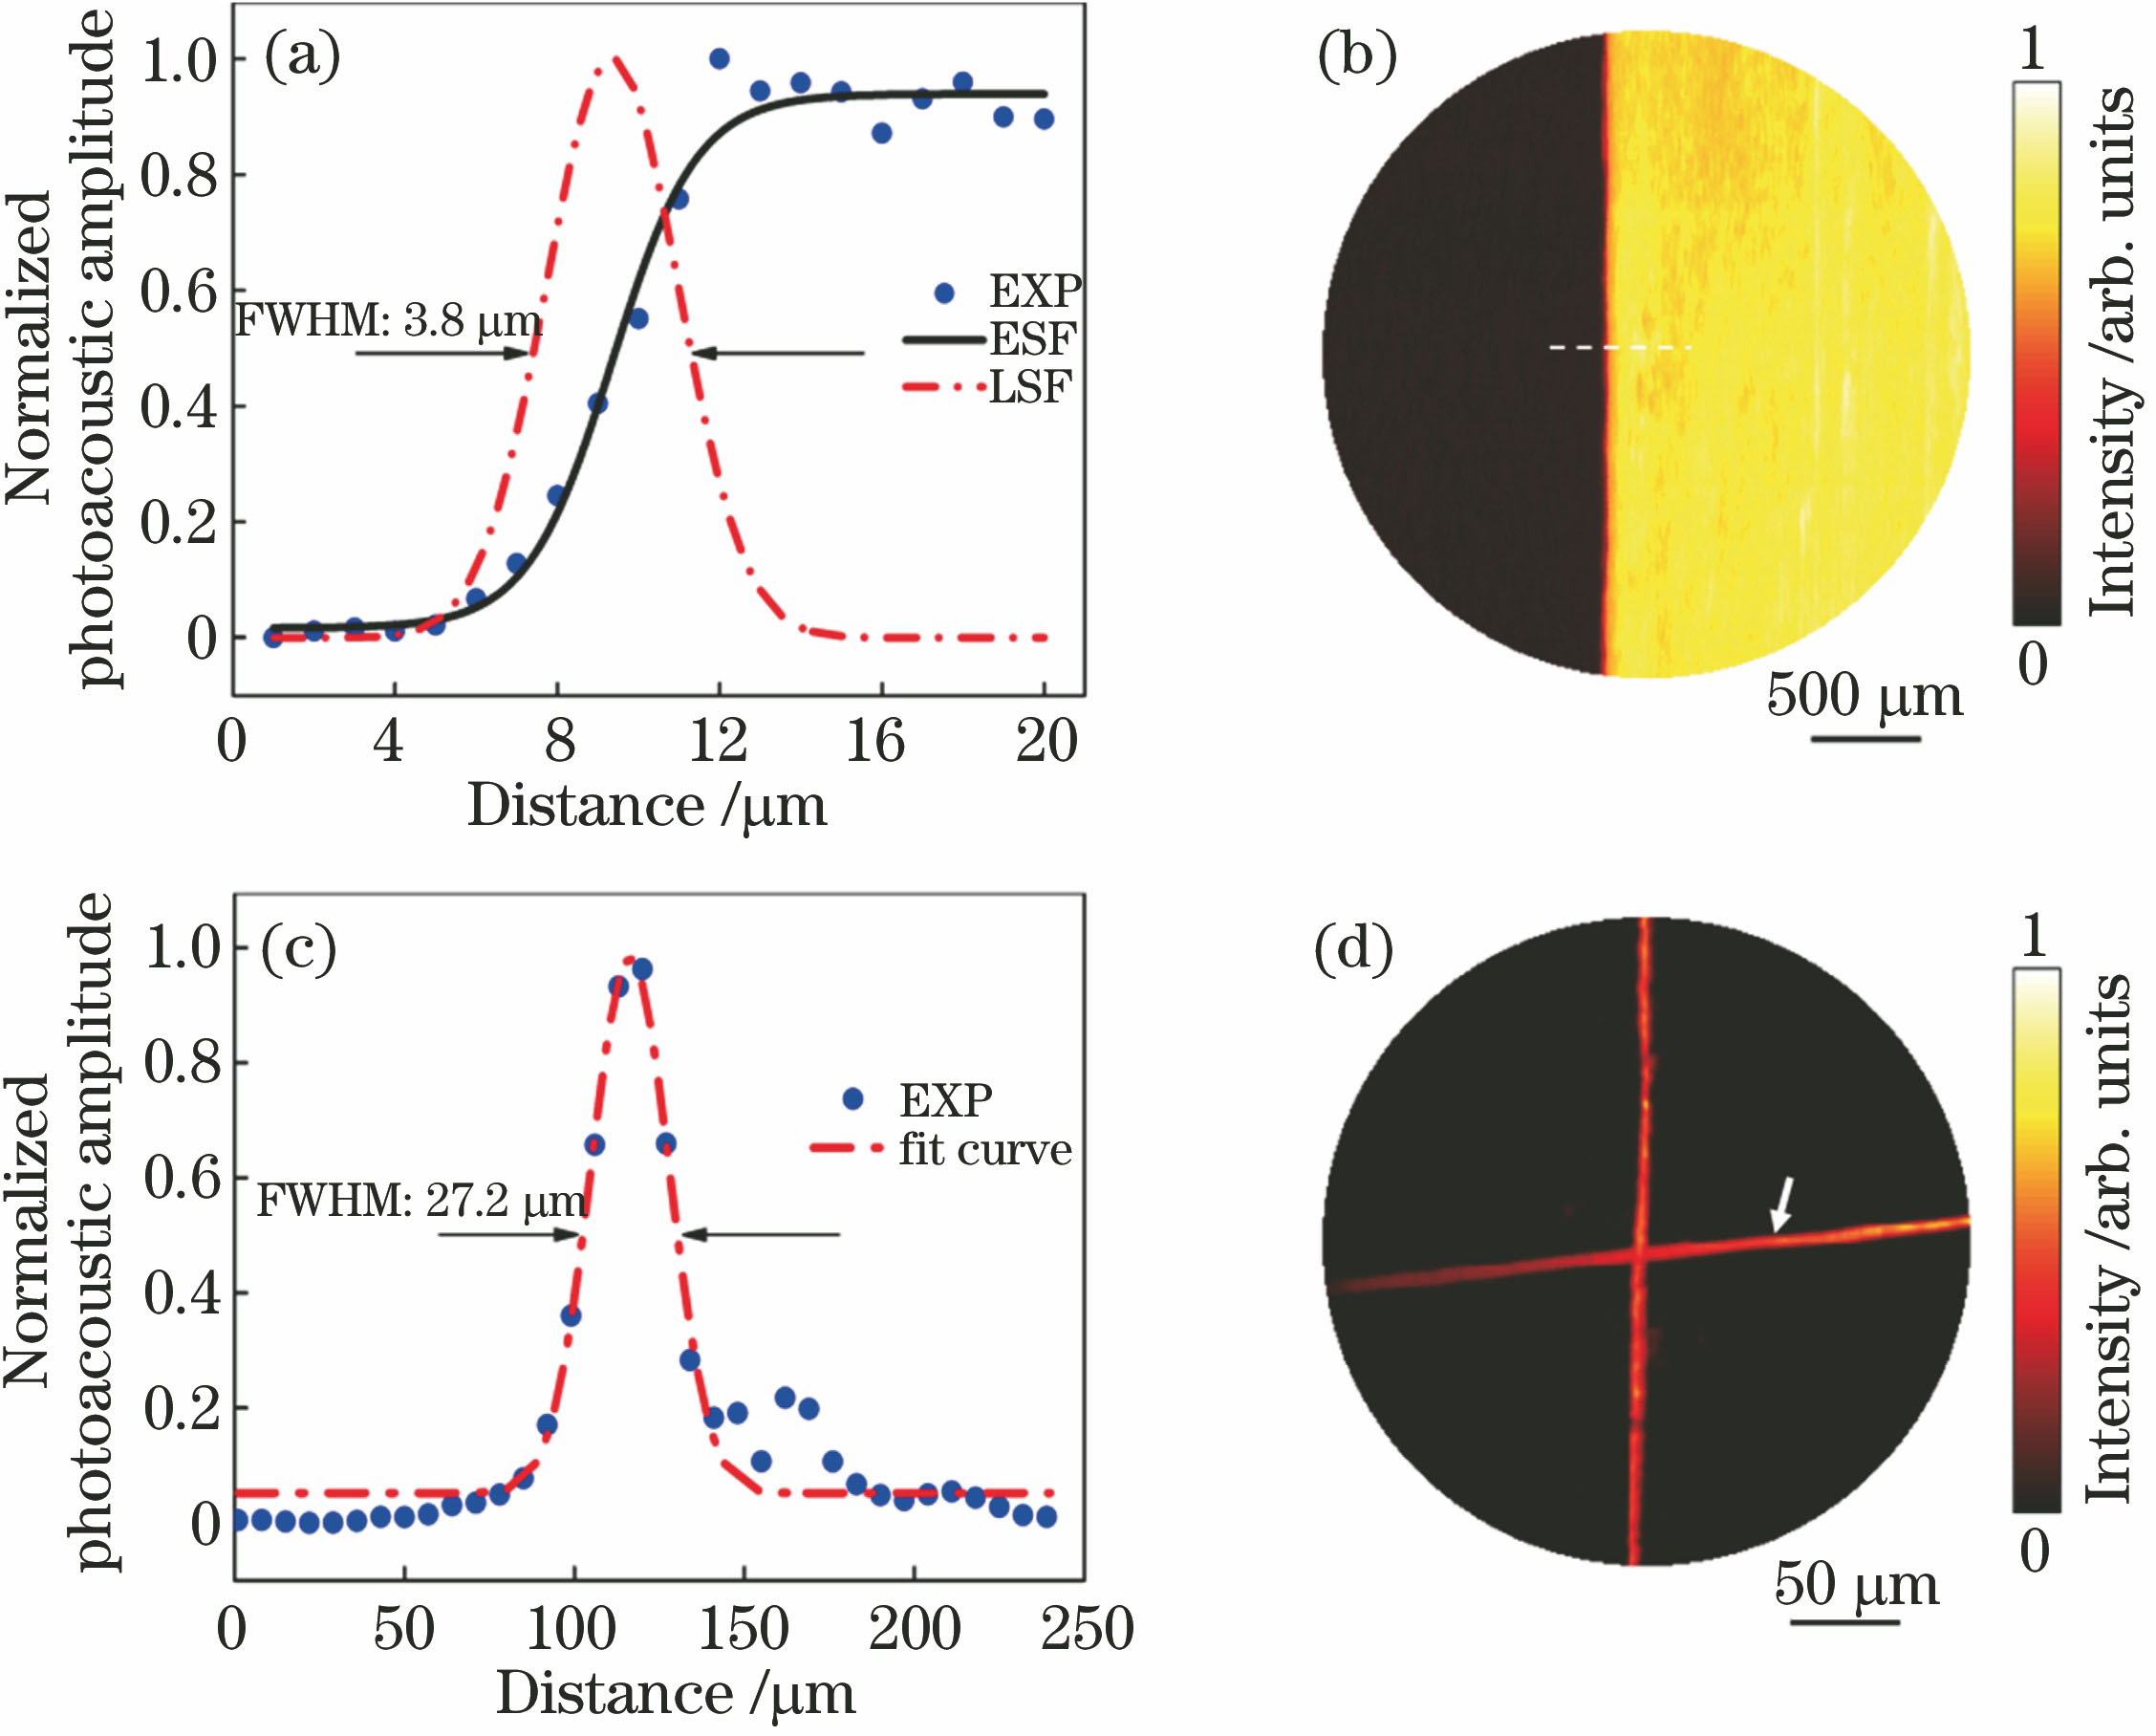
    Fig. 2. Spatial resolution test results of imaging system. (a) Fitted lateral profiles of blade edge; (b) photoacoustic MAP image of blade edge; (c) Gaussian-fitted axial profile of single carbon fiber; (d) MAP image of carbon fibers
    Imaging depth test results of system. (a) Photo of phantom; (b) photoacoustic imaging result
    Fig. 3. Imaging depth test results of system. (a) Photo of phantom; (b) photoacoustic imaging result
    High-resolution photoacoustic microscopic imaging results of micro-vessels in ear of healthy mouse. (a) Photo of mouse; (b) depth-encoded photoacoustic imaging result of ear vessels; (c) enlarged circle area in Fig. 4(b); (d) Gaussian-fitted profile of photoacoustic signal intensity along white line in enlarged area
    Fig. 4. High-resolution photoacoustic microscopic imaging results of micro-vessels in ear of healthy mouse. (a) Photo of mouse; (b) depth-encoded photoacoustic imaging result of ear vessels; (c) enlarged circle area in Fig. 4(b); (d) Gaussian-fitted profile of photoacoustic signal intensity along white line in enlarged area
    Steps and results of vascular signal extraction. (a) Flowchart of vascular signal extraction algorithm; (b) original image of mouse ear vessels (rectangle area in Fig. 4); (c) feature MAP of mouse ear vessels; (d) enhanced image of mouse ear vessels; (e) extracted vessels of mouse ear
    Fig. 5. Steps and results of vascular signal extraction. (a) Flowchart of vascular signal extraction algorithm; (b) original image of mouse ear vessels (rectangle area in Fig. 4); (c) feature MAP of mouse ear vessels; (d) enhanced image of mouse ear vessels; (e) extracted vessels of mouse ear
    Effect comparison of tumor vessel extraction. (a) Photoacoustic image of tumor vessels; (b) enlarged image of red dashed rectangle area in Fig. 6(a); (c) processing result of 2D Hessian matrix algorithm; (d) processing result of 3D Hessian matrix algorithm
    Fig. 6. Effect comparison of tumor vessel extraction. (a) Photoacoustic image of tumor vessels; (b) enlarged image of red dashed rectangle area in Fig. 6(a); (c) processing result of 2D Hessian matrix algorithm; (d) processing result of 3D Hessian matrix algorithm
    Continuous unmarked monitoring results of tumor angiogenesis in ear of mouse. (a)-(c) Depth-encoded photoacoustic imaging results of tumor vessels on day 0, day 2, day 4; (d)-(f) MAPs of extracted vessels corresponding to Figs. 7(a)-(c); (g) quantitative results of vessel density on different days; (h) quantitative results of vessel tortuosity on different days; (i) quantitative results of vessel diameter Dv distribution on different days
    Fig. 7. Continuous unmarked monitoring results of tumor angiogenesis in ear of mouse. (a)-(c) Depth-encoded photoacoustic imaging results of tumor vessels on day 0, day 2, day 4; (d)-(f) MAPs of extracted vessels corresponding to Figs. 7(a)-(c); (g) quantitative results of vessel density on different days; (h) quantitative results of vessel tortuosity on different days; (i) quantitative results of vessel diameter Dv distribution on different days
    Continuous unmarked monitoring changes of mouse tumor vessels response to anti-angiogenic therapy. (a)-(d) Depth encoded photoacoustic imaging results of tumor vessels on day 0, day 4, day 5, day 6; (e)-(h) MAPs of extracted vessels corresponding to Figs. 8(a)-(d); (i) quantitative results of vessel density on different days; (j) quantitative results of vessel tortuosity on different days; (k) quantitative results of vessel diameter Dv distribution on different days
    Fig. 8. Continuous unmarked monitoring changes of mouse tumor vessels response to anti-angiogenic therapy. (a)-(d) Depth encoded photoacoustic imaging results of tumor vessels on day 0, day 4, day 5, day 6; (e)-(h) MAPs of extracted vessels corresponding to Figs. 8(a)-(d); (i) quantitative results of vessel density on different days; (j) quantitative results of vessel tortuosity on different days; (k) quantitative results of vessel diameter Dv distribution on different days
    Chen Ningbo, Zhou Huichao, Zhao Huangxuan, Wang Boquan, Song Liang, Liu Chengbo, Zhang Jianhui. High-Resolution Photoacoustic Quantitative Imaging of Tumor Vessels[J]. Chinese Journal of Lasers, 2019, 46(9): 907001
    Download Citation