
Shuang YE, Mei-hua CHEN, Gai WU, Shuang HE. Spectroscopic Characteristics and Identification Methods of Color-Treated Purplish Red Diamonds[J]. Spectroscopy and Spectral Analysis, 2022, 42(1): 191
- Spectroscopy and Spectral Analysis
- Vol. 42, Issue 1, 191 (2022)
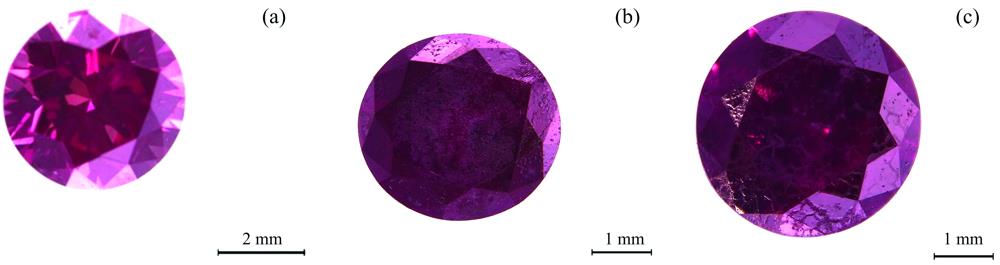
Fig. 1. Samples of purplish red diamond
(a): Sample DR-1; (b): Sample DR-2; (c): Sample ccDR-3
(a): Sample DR-1; (b): Sample DR-2; (c): Sample ccDR-3
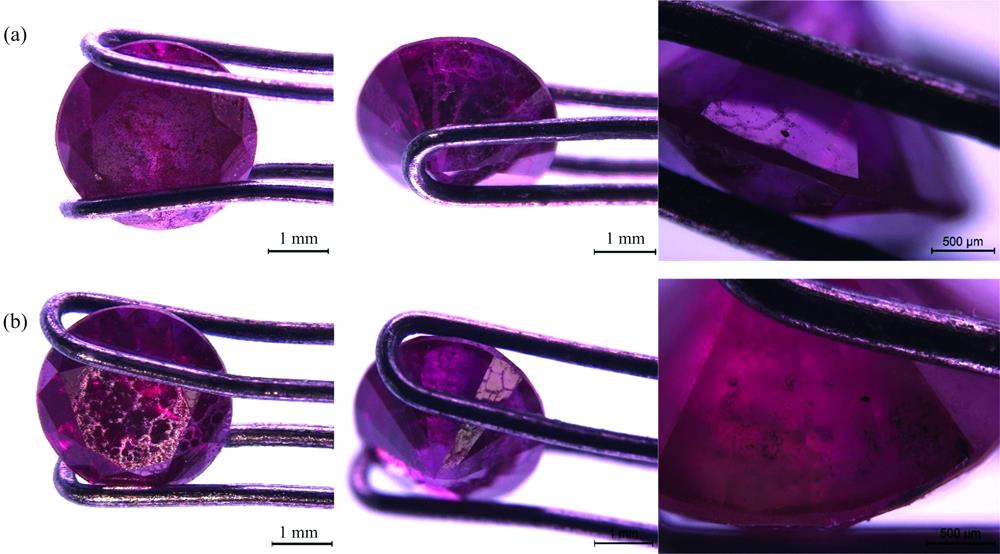
Fig. 2. Evidence of HPHT treatment for diamond samples
(a): Sample DR-2; (b): Sample DR-3
(a): Sample DR-2; (b): Sample DR-3
Fig. 3. Fluorescence phenomenon of diamond samples under long-wavelength UV lamp
(a): Sample DR-1; (b): Sample DR-2; (c): Sample DR-3
(a): Sample DR-1; (b): Sample DR-2; (c): Sample DR-3
Fig. 4. Fluorescence phenomenon of diamond samples under GV5000
(a): sample DR-1; (b): sample DR-2; (c): sample DR-3
(a): sample DR-1; (b): sample DR-2; (c): sample DR-3
Fig. 5. Mid-infraed (a) and near-infrared (b) spectra of diamond samples (The spectra are offset vertically for clarity)
Fig. 6. UV-VIS-NIR reflectance spectra of diamond samples (The spectra are offset vertically for clarity)
Fig. 7. Fluorescence spectra of Contour map (a, b, c) and 3D steregram (d, e, f) for samples
(a, d): Sample DR-1; (b, e): Sample DR-2; (c, f): Sample DR-3
(a, d): Sample DR-1; (b, e): Sample DR-2; (c, f): Sample DR-3
Fig. 8. Photoluminescence spectra of diamond samples (EX 325 nm and EX 532 nm)
(a): Sample DR-1, EX 325 nm; (b): Sample DR-2, EX 325 nm; (c): Sample DR-3, EX 325 nm;(d): Sample DR-1, EX 532 nm; (e): Sample DR-2, EX 532 nm; (f): Sample DR-3, EX 532 nm
(a): Sample DR-1, EX 325 nm; (b): Sample DR-2, EX 325 nm; (c): Sample DR-3, EX 325 nm;(d): Sample DR-1, EX 532 nm; (e): Sample DR-2, EX 532 nm; (f): Sample DR-3, EX 532 nm

Set citation alerts for the article
Please enter your email address
© Copyright 2018-2021 | Chinese Laser Press. All Rights Reserved 沪ICP备15018463号-20