
Wenqiang Bao, Jinlong Yu, Wenrui Wang. High-Rate Optical Sampling Based on Optoelectronic Oscillator[J]. Laser & Optoelectronics Progress, 2018, 55(6): 060701
- Laser & Optoelectronics Progress
- Vol. 55, Issue 6, 060701 (2018)
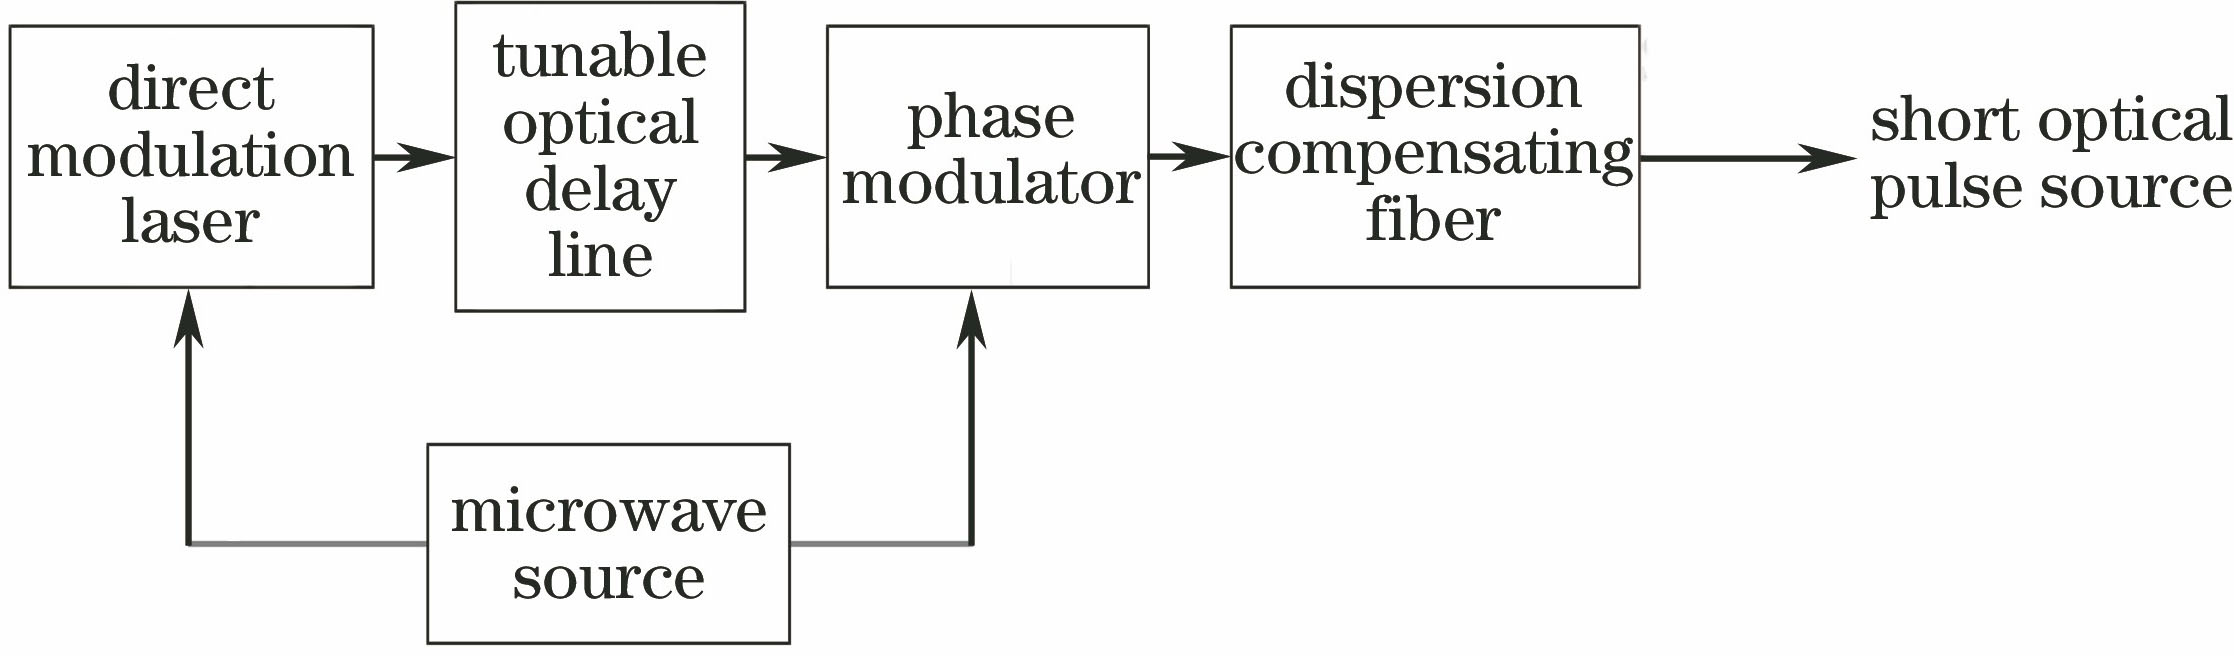
Fig. 1. Schematic of narrow light pulses produced by a direct tuning laser and a phase modulator
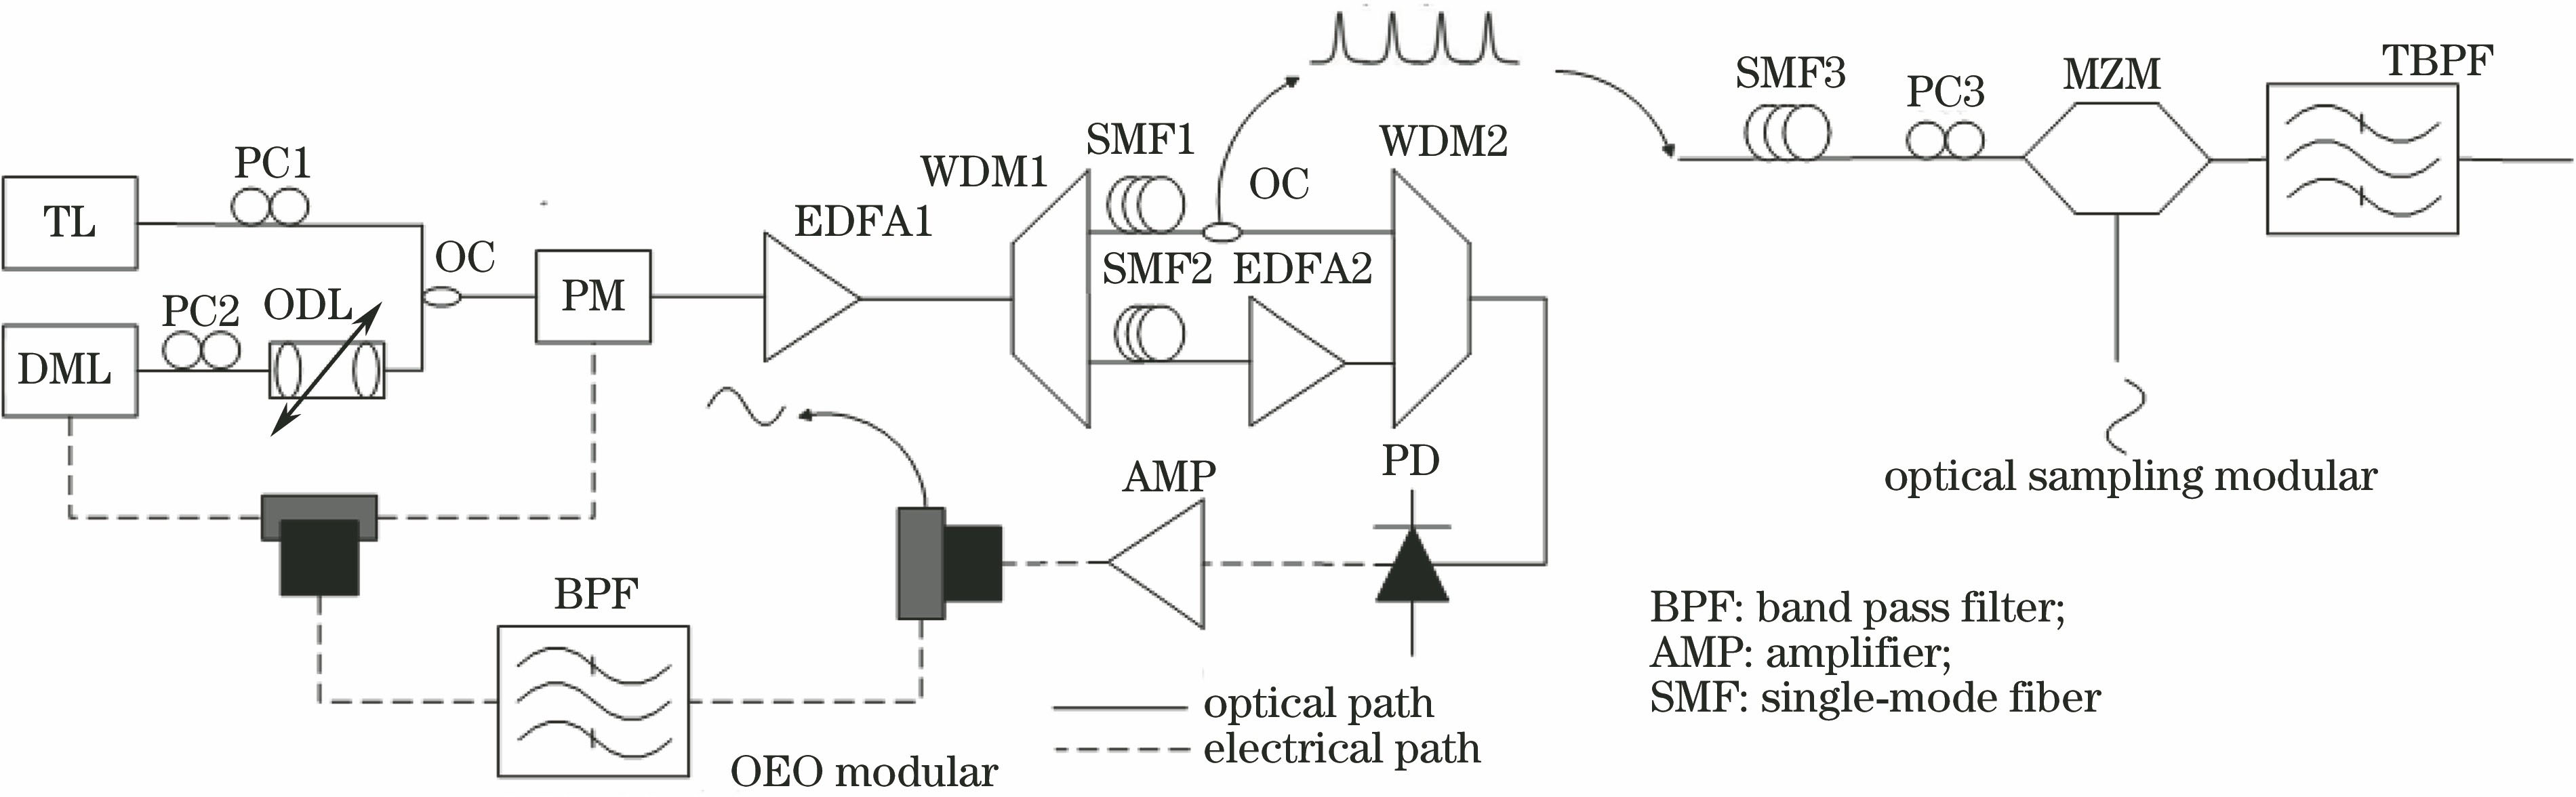
Fig. 2. Optical sampling experiment based on dual-wavelength OEO
Fig. 3. (a) Pulse width without phase modulator; (b) pulse width with phase modulator
Fig. 4. Phase noise of microwave signals generated in experiments
Fig. 5. Time-domain waveform of pulses generated in experiments
Fig. 6. (a) Original waveform of 10 GHz sine wave; (b) original waveform of 2.5 GHz square wave
Fig. 7. Sampling results of DC signals. (a) 1550.4 nm; (b) 1550.6 nm; (c) 1550.8 nm; (d) 1551.0 nm
Fig. 8. Spectra corresponding to DC sampling results. (a) 1550.4 nm; (b) 1550.6 nm; (c) 1550.8 nm; (d) 1551.0 nm
Fig. 9. Recovery diagram of DC signal sampling results
Fig. 10. Corrected results of DC signal sampling
Fig. 11. Waveforms. (a) Waveform recovery diagram of 10 GHz sine wave sampling; (b) waveform recovery diagram of 2.5 GHz square wave sampling; (c) corrected waveform of 10 GHz sine wave sampling; (d) corrected waveform of 2.5 GHz square wave sampling

Set citation alerts for the article
Please enter your email address
© Copyright 2018-2021 | Chinese Laser Press. All Rights Reserved 沪ICP备15018463号-20