• Photonics Research
  • Vol. 10, Issue 10, 2405 (2022)
Jie Luan1、2、7、*, Philip St.J. Russell1, and David Novoa1、3、4、5、6、8、*
Author Affiliations
  • 1Max Planck Institute for the Science of Light, 91058 Erlangen, Germany
  • 2Department of Physics, Friedrich-Alexander-Universität, 91058 Erlangen, Germany
  • 3Department of Communications Engineering, Engineering School of Bilbao, University of the Basque Country (UPV/EHU), 48013 Bilbao, Spain
  • 4EHU Quantum Center, University of the Basque Country (UPV/EHU), 48013 Bilbao, Spain
  • 5IKERBASQUE, Basque Foundation for Science, 48009 Bilbao, Spain
  • 6Previously with the Max Planck Institute for the Science of Light, 91058 Erlangen, Germany
  • 7e-mail:
  • 8e-mail:
  • show less
    DOI: 10.1364/PRJ.464376 Cite this Article Set citation alerts
    Jie Luan, Philip St.J. Russell, David Novoa. High-quality 8-fold self-compression of ultrashort near-UV pulses in an Ar-filled ultrathin-walled photonic crystal fiber[J]. Photonics Research, 2022, 10(10): 2405 Copy Citation Text show less
    Compression length as a function of gas pressure and fiber core diameter. We consider bandwidth-limited, 40-fs-long pump pulses with 1.8 μJ centered at 400 nm. The dashed line marks the boundary between regions of normal (N) and anomalous (A) dispersion. Inset, soliton order for a subset of parameters. The pink dot marks the operating point of the system, namely, N∼3 and LC∼1.15 m.
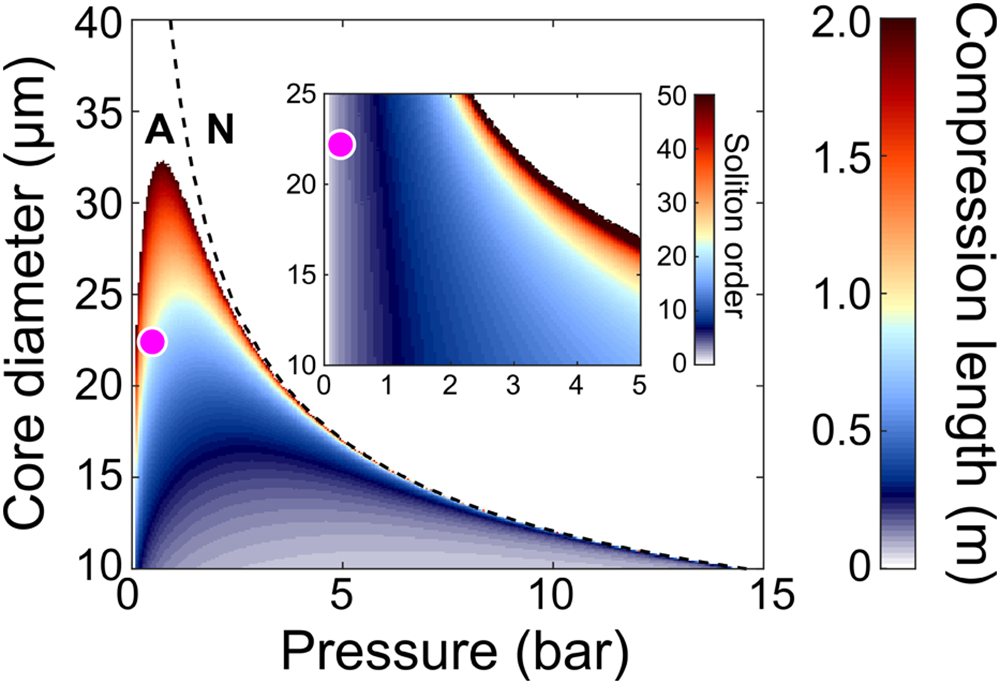
    Fig. 1. Compression length as a function of gas pressure and fiber core diameter. We consider bandwidth-limited, 40-fs-long pump pulses with 1.8 μJ centered at 400 nm. The dashed line marks the boundary between regions of normal (N) and anomalous (A) dispersion. Inset, soliton order for a subset of parameters. The pink dot marks the operating point of the system, namely, N3 and LC1.15  m.
    GVD of the evacuated (solid green) and Ar-filled (solid blue) ARR-PCF as a function of wavelength. The zero-dispersion wavelength of the Ar-filled fiber is ∼226 nm. Regions of normal (N) and anomalous (A) dispersion are highlighted by the light red and white shading. Inset, scanning electron micrograph of the fiber core structure.
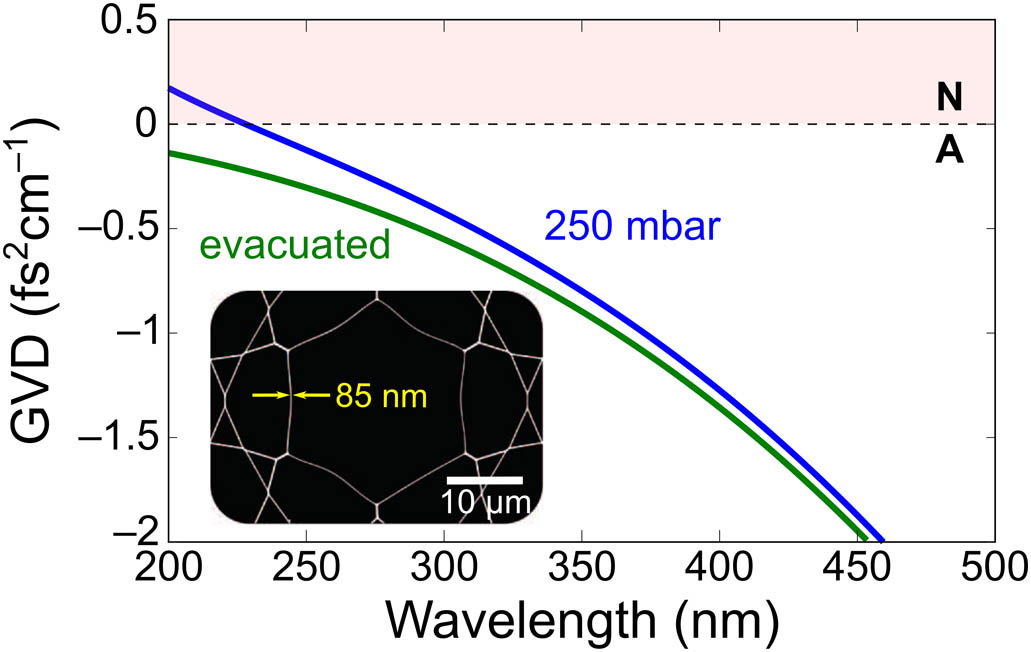
    Fig. 2. GVD of the evacuated (solid green) and Ar-filled (solid blue) ARR-PCF as a function of wavelength. The zero-dispersion wavelength of the Ar-filled fiber is 226  nm. Regions of normal (N) and anomalous (A) dispersion are highlighted by the light red and white shading. Inset, scanning electron micrograph of the fiber core structure.
    (a) Experimental setup. CM, chirped mirrors; W, wedges; FS, fused silica plate. The dashed line encloses the home-built, all-reflective SD-FROG system. Inset, self-diffracted orders on a view card placed at the position of the physical block. (b) Temporal profile of the pump pulses characterized using SD-FROG. Inset, transverse beam profile of the pump pulses.
    Fig. 3. (a) Experimental setup. CM, chirped mirrors; W, wedges; FS, fused silica plate. The dashed line encloses the home-built, all-reflective SD-FROG system. Inset, self-diffracted orders on a view card placed at the position of the physical block. (b) Temporal profile of the pump pulses characterized using SD-FROG. Inset, transverse beam profile of the pump pulses.
    (a) Measured and (b) retrieved SD-FROG spectrograms. (c) Retrieved normalized temporal intensity of the self-compressed pulses. The points t1 =−12.2 fs and t2 =10.1 fs are the limits of integration defined in the numerator of Eq. (1). Inset, transverse beam profile of the self-compressed pulses. (d) Retrieved normalized spectral intensity (solid blue line), spectral phase (dashed orange line), and measured reference spectrum (shaded gray).
    Fig. 4. (a) Measured and (b) retrieved SD-FROG spectrograms. (c) Retrieved normalized temporal intensity of the self-compressed pulses. The points t1=12.2  fs and t2=10.1  fs are the limits of integration defined in the numerator of Eq. (1). Inset, transverse beam profile of the self-compressed pulses. (d) Retrieved normalized spectral intensity (solid blue line), spectral phase (dashed orange line), and measured reference spectrum (shaded gray).
    Simulated (a) spectral and (b) temporal evolution of the pulses using the measured initial pump profile, propagating along the ARR-PCF employed in the experiment. To achieve the best agreement with the experimental results, the simulated input pulse energy was decreased to 1.8 μJ (there is some uncertainty in the values of the nonlinear coefficients in the UV). The plots are normalized to the overall maximum intensity and the time delay is relative to a reference frame co-moving at the pump group velocity.
    Fig. 5. Simulated (a) spectral and (b) temporal evolution of the pulses using the measured initial pump profile, propagating along the ARR-PCF employed in the experiment. To achieve the best agreement with the experimental results, the simulated input pulse energy was decreased to 1.8 μJ (there is some uncertainty in the values of the nonlinear coefficients in the UV). The plots are normalized to the overall maximum intensity and the time delay is relative to a reference frame co-moving at the pump group velocity.
    (a) Simulated (solid red line) and directly measured [shaded gray; see also Fig. 4(d)] spectral profiles of the out-coupled pulses, together with the initial pump spectrum (solid blue line). The result of applying a super-Gaussian filter of 67 nm full width at half-maximum and centered at 387 nm to the simulated spectrum is also displayed in dashed purple line. (b) Simulated (solid red line) and retrieved (shaded cyan) temporal profiles of the out-coupled pulses. For comparison, the temporal profile corresponding to the filtered spectrum shown in (a) is also included in dashed purple line.
    Fig. 6. (a) Simulated (solid red line) and directly measured [shaded gray; see also Fig. 4(d)] spectral profiles of the out-coupled pulses, together with the initial pump spectrum (solid blue line). The result of applying a super-Gaussian filter of 67 nm full width at half-maximum and centered at 387 nm to the simulated spectrum is also displayed in dashed purple line. (b) Simulated (solid red line) and retrieved (shaded cyan) temporal profiles of the out-coupled pulses. For comparison, the temporal profile corresponding to the filtered spectrum shown in (a) is also included in dashed purple line.
    Jie Luan, Philip St.J. Russell, David Novoa. High-quality 8-fold self-compression of ultrashort near-UV pulses in an Ar-filled ultrathin-walled photonic crystal fiber[J]. Photonics Research, 2022, 10(10): 2405
    Download Citation