
Peixuan Li, Pengfei Liu, Feidao Cao, Huaici Zhao. Weight-Adaptive Cross-Scale Algorithm for Stereo Matching[J]. Acta Optica Sinica, 2018, 38(12): 1215006
- Acta Optica Sinica
- Vol. 38, Issue 12, 1215006 (2018)
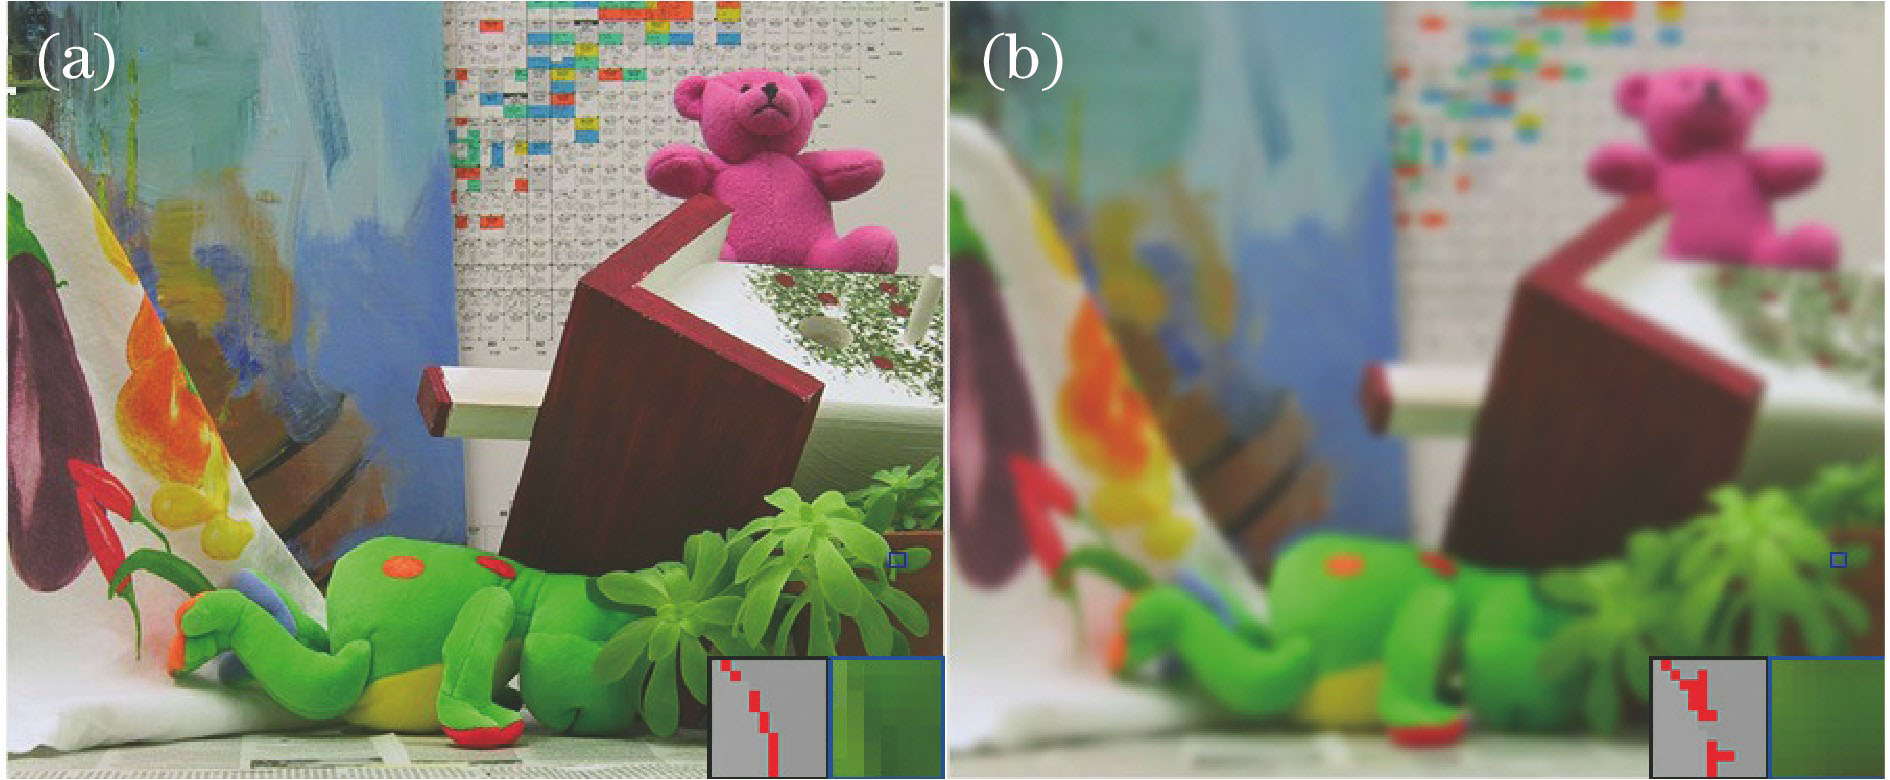
Fig. 1. Image (blue box) and mismatching points (black box) of certain pixel window when cost aggregation performed at different scales. (a) Original image; (b) second-scale image
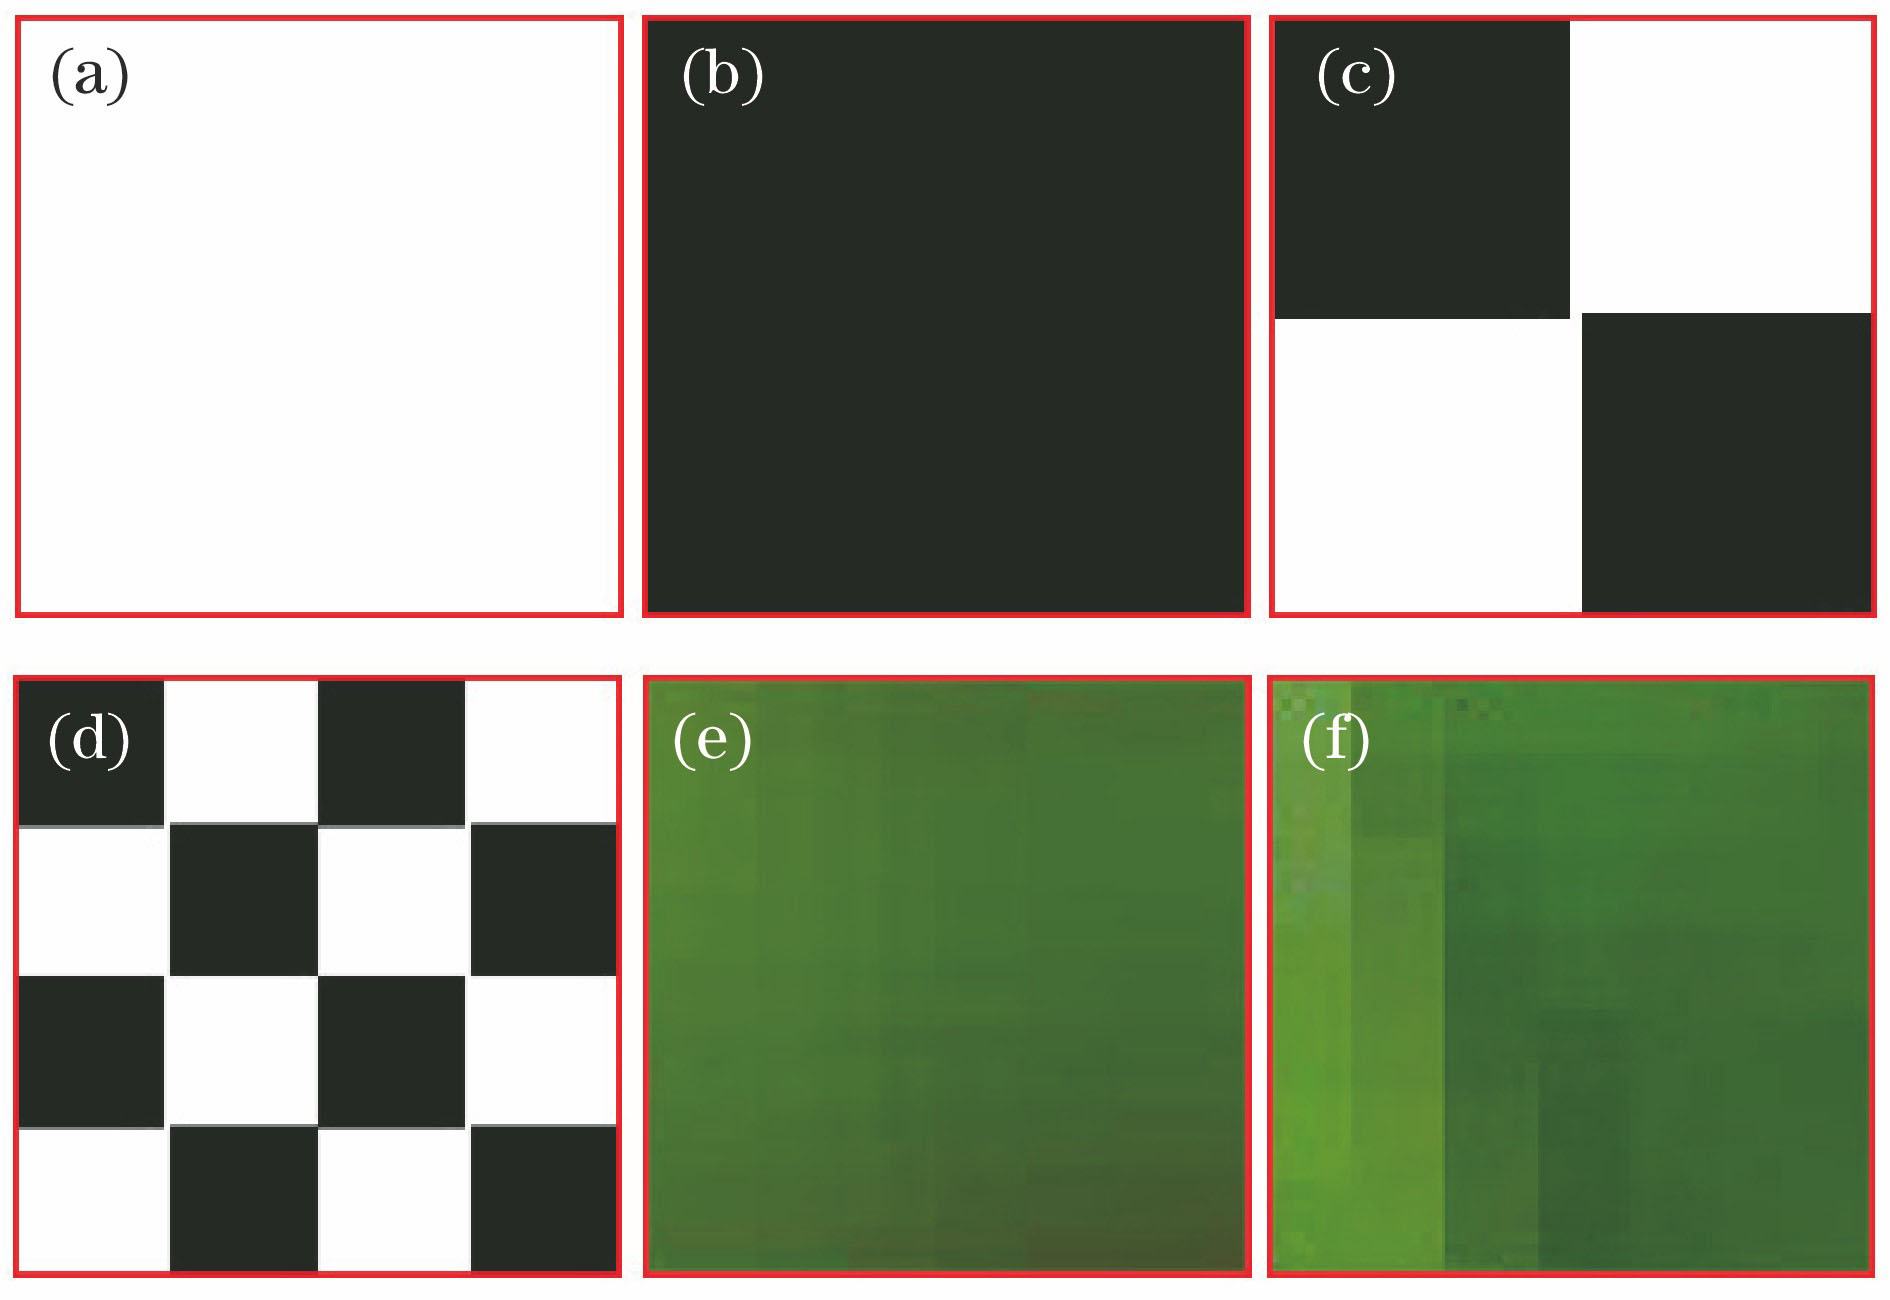
Fig. 2. Different images and corresponding information entropy. (a) E=0 for pure white image information; (b) E=0 for pure black image; (c) E=1.0413 for 4-grid image; (d) E=1.3476 for 16-grid image; (e) E=5.0542 for image in blue box of Fig. 1(b); (f) E=5.6215 for image in blue box of Fig. 1(a)
Fig. 3. Parallax maps of Teddy images by different methods
|
Table 1. Parameters for proposed cross-scale cost matching algorithm
| |||||||||||||||||||||||||||||||||||||||||||||||||||||||||||||||||||||||||||||||||||||||||||||||||||||||||||||||||||||||||||||
Table 2. Matching error comparison between proposed method and that in Ref. [12] when dead pixel rate is 2%
|
Table 3. Running time comparison for cost aggregation by guiding filterss

Set citation alerts for the article
Please enter your email address
© Copyright 2018-2021 | Chinese Laser Press. All Rights Reserved 沪ICP备15018463号-20