• Laser & Optoelectronics Progress
  • Vol. 59, Issue 4, 0434001 (2022)
Qi Guo1, Hong Jiang1、*, Jinjie Yang1, Kenan Wu2, and Ji Man3
Author Affiliations
  • 1Institute of Criminal Investigation, People's Public Security University of China, Beijing 100038, China
  • 2Institute of Computer Science and Technology, Wuhan University of Technology, Wuhan , Hubei 430070, China
  • 3Beijing Huayi Honrizon Technology Co., Ltd., Beijing 100123, China
  • show less
    DOI: 10.3788/LOP202259.0434001 Cite this Article Set citation alerts
    Qi Guo, Hong Jiang, Jinjie Yang, Kenan Wu, Ji Man. Visual Inspection of Food Packaging Paper by X-Ray Fluorescence Spectroscopy Combined with Deep Learning Algorithm[J]. Laser & Optoelectronics Progress, 2022, 59(4): 0434001 Copy Citation Text show less
    Manual classification results
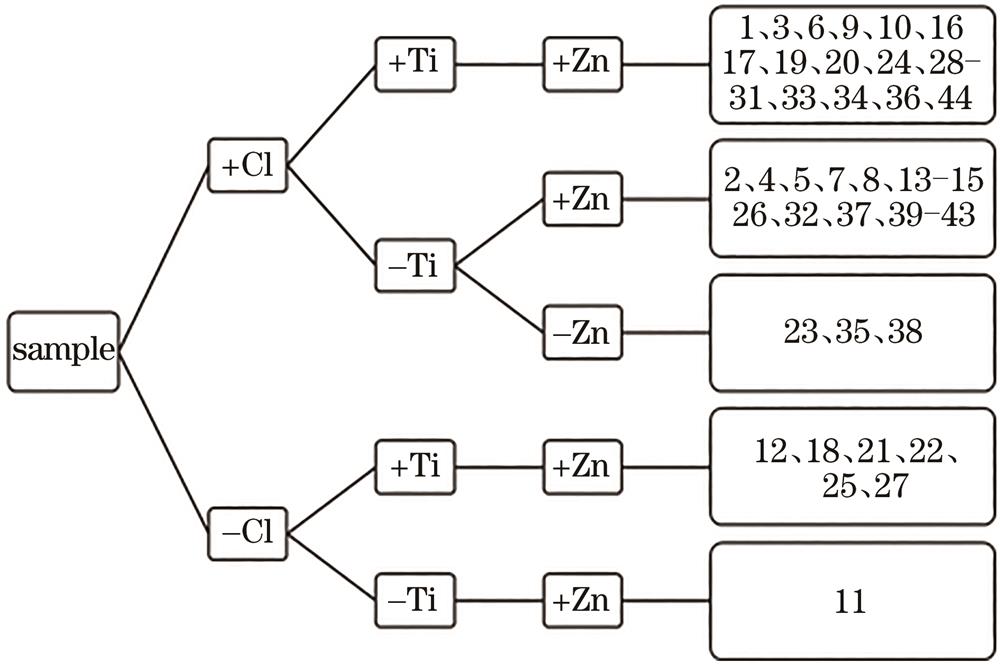
    Fig. 1. Manual classification results
    Tree diagram of clustering results
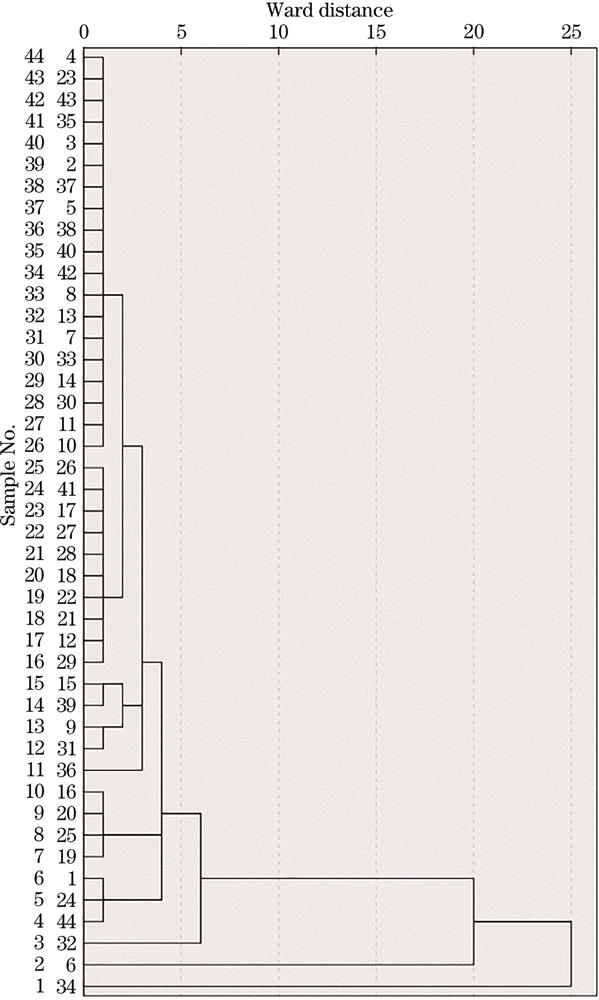
    Fig. 2. Tree diagram of clustering results
    Line chart of polymerization coefficient
    Fig. 3. Line chart of polymerization coefficient
    Comparison of 2D renderings of dimension reduction algorithms. (a) PCA; (b) tSNE
    Fig. 4. Comparison of 2D renderings of dimension reduction algorithms. (a) PCA; (b) tSNE
    Comparison of 3D renderings of dimension reduction algorithms. (a) PCA; (b) tSNE
    Fig. 5. Comparison of 3D renderings of dimension reduction algorithms. (a) PCA; (b) tSNE
    Sample No.CaFeSnZnClTiSample No.CaFeSnZnClTi
    1#134133626525972431523#17091528123030460
    2#26518515264267024#4302151371420373568
    3#710280125166422525#14422459972861560957
    4#22620352122142230026#361029502904824670
    5#1031231575134767027#577041754288530142
    6#338277723724315227057738628#866621987303523740145
    7#974593223151610029#1496573272374675898247
    8#241864119116629030#62564113922728754128
    9#984840131617843647231#8182716184303710852116
    10#925231318713250998832#441730028816204870
    11#502121358176470033#101941721218289828
    12#90821435125389023434#653951718254613789948821
    13#48022419913885035#51953493023290
    14#482751207220301688036#34836218342615781472457
    15#1681611763543602121037#2782311502853710
    16#1825375715355136202324938#374190111038460
    17#58463201526659179815539#873559885225644590
    18#110658307727195021640#13005510841513316500
    19#2848817290471259305061041#9972211632963718390
    20#2062085276435114260877242#1024568161653048220
    21#127196353630999030643#462526421251516820
    22#876812542281105031944#29072186975119344642
    Table 1. X-ray fluorescence detection results
    DimensionPCAtSNE
    2D0.255270.336786
    3D0.147720.0917815
    Table 2. Comparison of data loss values of two algorithms
    DatasetCategoryNumber of output result samples of each categoryAccuracy /%
    45679
    Train430000100.0
    503000100.0
    6002400100.0
    700020100.0
    900003100.0
    Overall percentage /%8.68.668.65.78.6100.0
    Test410000100.0
    501000100.0
    600500100.0
    700010100.0
    9000100.0
    Overall percentage /%11.111.155.622.20.088.9
    Table 3. Artificial neural network outputs classification results
    Qi Guo, Hong Jiang, Jinjie Yang, Kenan Wu, Ji Man. Visual Inspection of Food Packaging Paper by X-Ray Fluorescence Spectroscopy Combined with Deep Learning Algorithm[J]. Laser & Optoelectronics Progress, 2022, 59(4): 0434001
    Download Citation