• Acta Optica Sinica
  • Vol. 41, Issue 13, 1306004 (2021)
Shoulin Jiang1、**, Wei Jin1、2、*, Feifan Chen1、2, Shoufei Gao2, and Hoi Lut Ho1、2
Author Affiliations
  • 1Photonics Research Center, The Hong Kong Polytechnic University Shenzhen Research Institute, Shenzhen, Guangdong 518057, China
  • 2Department of Electrical Engineering, The Hong Kong Polytechnic University, Hong Kong, China
  • show less
    DOI: 10.3788/AOS202141.1306004 Cite this Article Set citation alerts
    Shoulin Jiang, Wei Jin, Feifan Chen, Shoufei Gao, Hoi Lut Ho. Carbon Dioxide Detection with High Sensitivity Based on Photo-Thermal Spectroscopy in Hollow-Core Optical Fiber[J]. Acta Optica Sinica, 2021, 41(13): 1306004 Copy Citation Text show less
    Calculated absorption lines of CO2 and H2O at 296 K and 1.01×10⁵ N/m2 from HITRAN2016
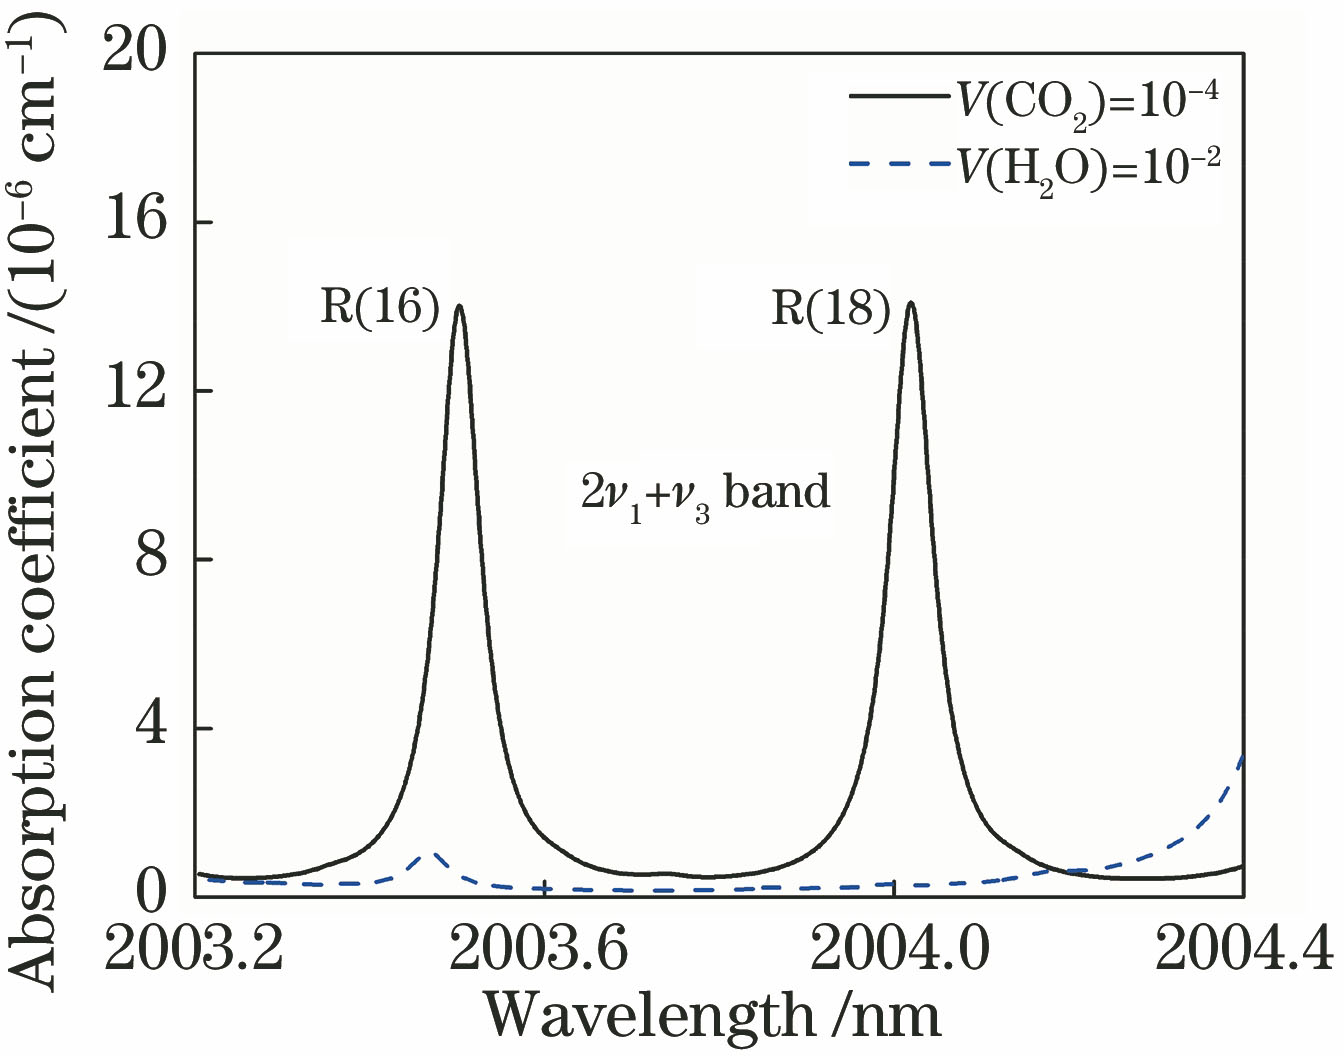
    Fig. 1. Calculated absorption lines of CO2 and H2O at 296 K and 1.01×10⁵ N/m2 from HITRAN2016
    Photo-thermal gas detection system. (a) Experimental setup; (b) SEM image of HC-ARF; (c) F-P gas cell
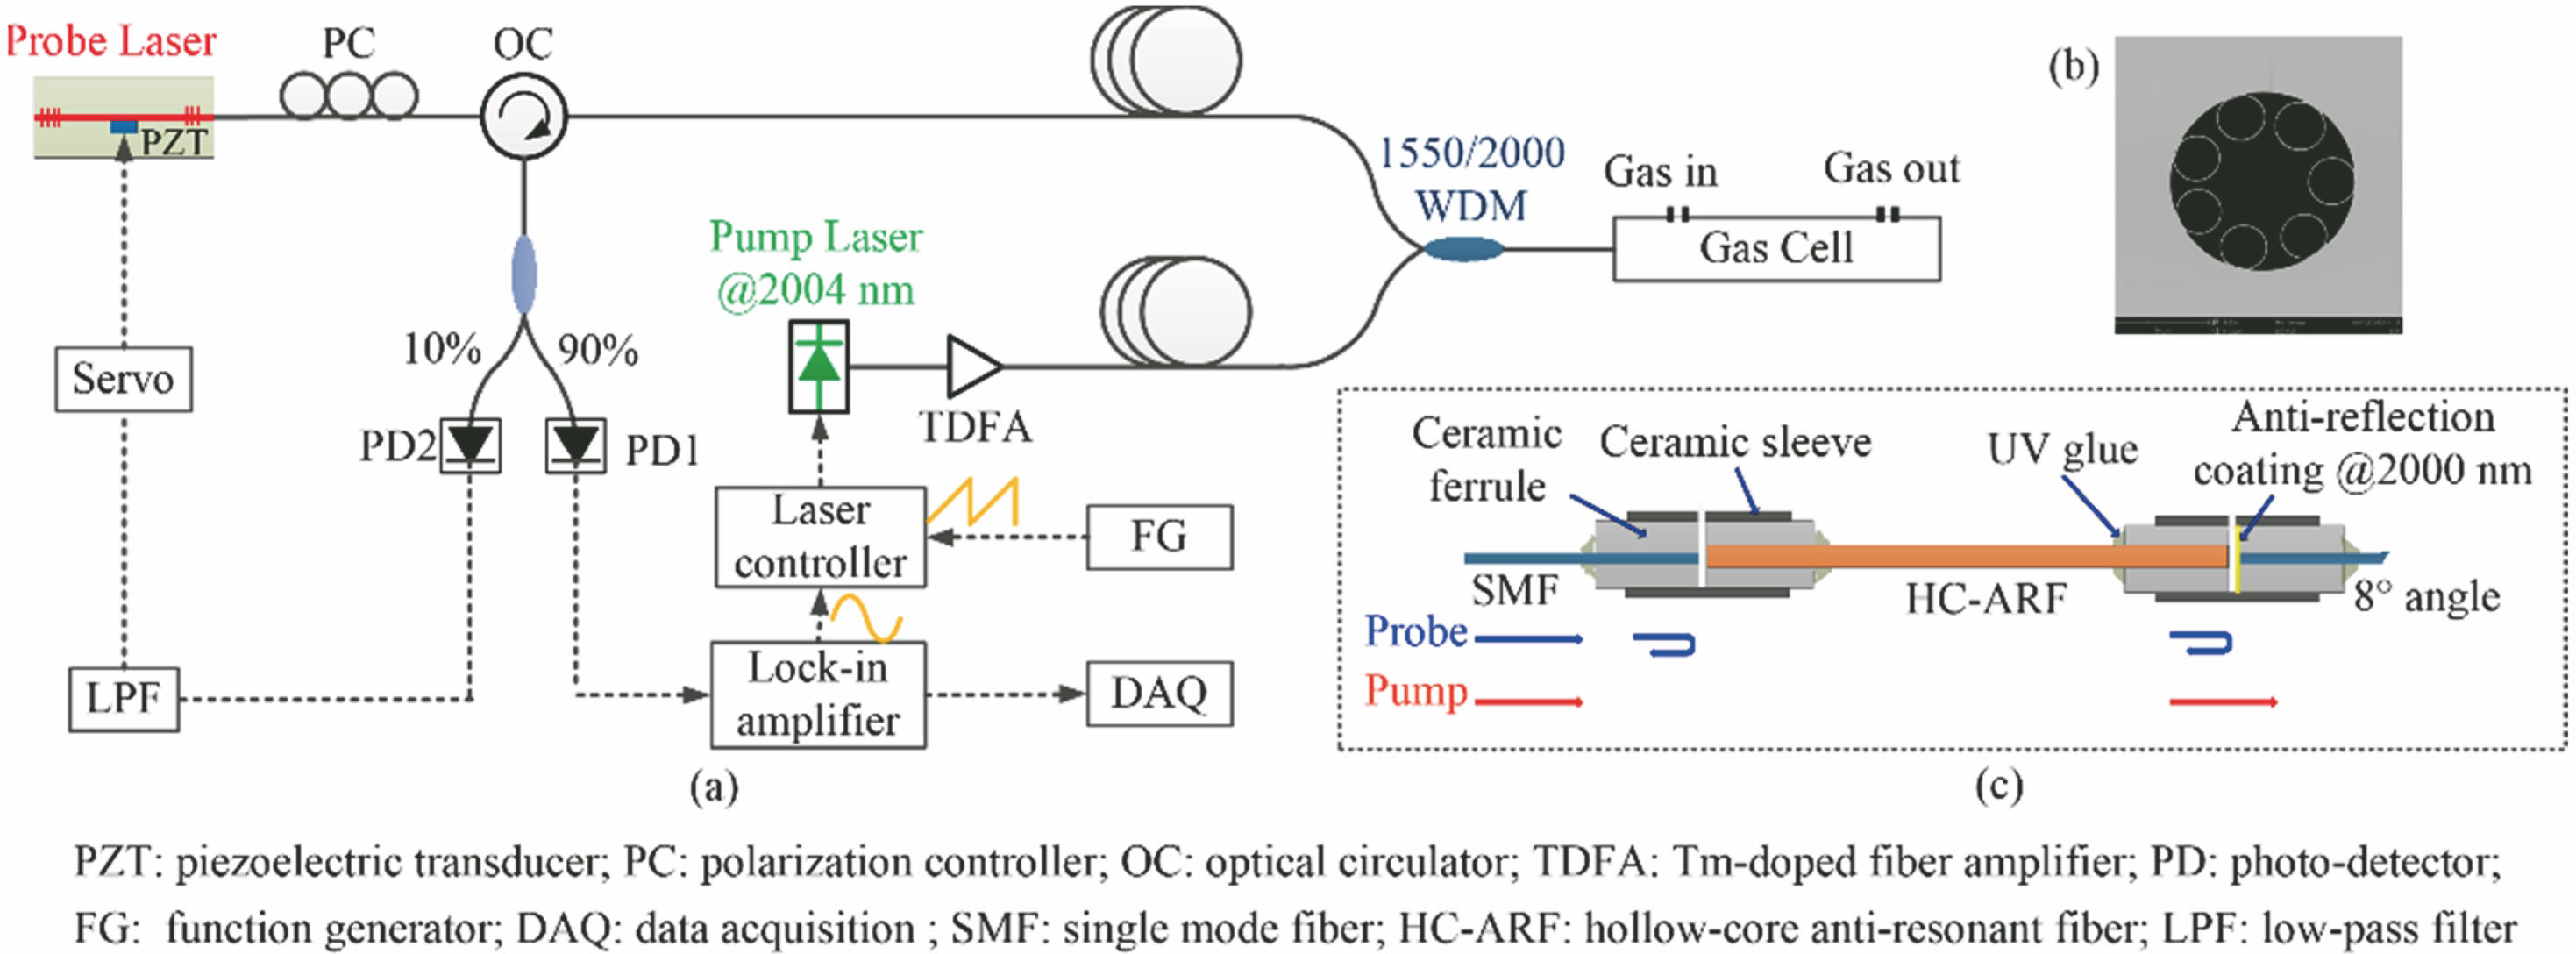
    Fig. 2. Photo-thermal gas detection system. (a) Experimental setup; (b) SEM image of HC-ARF; (c) F-P gas cell
    Reflection spectra of the fabricated F-P cavities with low quality factors
    Fig. 3. Reflection spectra of the fabricated F-P cavities with low quality factors
    Effect of modulation depth and modulation frequency on the amplitude of the signal. (a) Relationship between the normalized amplitude and modulation depth with 10 kHz modulation frenquency; (b) frequency response of the normalized amplitude and noise with 0.14 cm-1 modulation depth
    Fig. 4. Effect of modulation depth and modulation frequency on the amplitude of the signal. (a) Relationship between the normalized amplitude and modulation depth with 10 kHz modulation frenquency; (b) frequency response of the normalized amplitude and noise with 0.14 cm-1 modulation depth
    Influence of AR coating on the rear end face. (a) 2f spectra at V(CO2)=10-4; (b) noise with pure N2
    Fig. 5. Influence of AR coating on the rear end face. (a) 2f spectra at V(CO2)=10-4; (b) noise with pure N2
    Detection performance of CO2 concentration. (a) 2f spectrum at V(CO2)=10-5; (b) 2f signal amplitude at different volume fractions
    Fig. 6. Detection performance of CO2 concentration. (a) 2f spectrum at V(CO2)=10-5; (b) 2f signal amplitude at different volume fractions
    Measuremental results of the CO2 standard gas within 1 h at V(CO2)=10-5. (a) 2f spectrum; (b) peak-to-peak value
    Fig. 7. Measuremental results of the CO2 standard gas within 1 h at V(CO2)=10-5. (a) 2f spectrum; (b) peak-to-peak value
    Influence of pump power on the 2f signal amplitude/noise. (a) 2f signal spectra at V(CO2)=10-4; (b) relationship between the 2f signal amplitude/noise and the pump power
    Fig. 8. Influence of pump power on the 2f signal amplitude/noise. (a) 2f signal spectra at V(CO2)=10-4; (b) relationship between the 2f signal amplitude/noise and the pump power
    Influence of intensity noise and phase noise. (a) Relationship between the noise and received power in 15-cm-long gas cell; (b) relationship between the noise and F-P cavity length with received power of 620 μW
    Fig. 9. Influence of intensity noise and phase noise. (a) Relationship between the noise and received power in 15-cm-long gas cell; (b) relationship between the noise and F-P cavity length with received power of 620 μW
    Shoulin Jiang, Wei Jin, Feifan Chen, Shoufei Gao, Hoi Lut Ho. Carbon Dioxide Detection with High Sensitivity Based on Photo-Thermal Spectroscopy in Hollow-Core Optical Fiber[J]. Acta Optica Sinica, 2021, 41(13): 1306004
    Download Citation