
Zhiyong Tao, Lei Zhang, Sen Lin. Low-Illuminance Texture Image Enhancement Method Based on SCBSO Algorithm[J]. Laser & Optoelectronics Progress, 2019, 56(24): 241002
- Laser & Optoelectronics Progress
- Vol. 56, Issue 24, 241002 (2019)
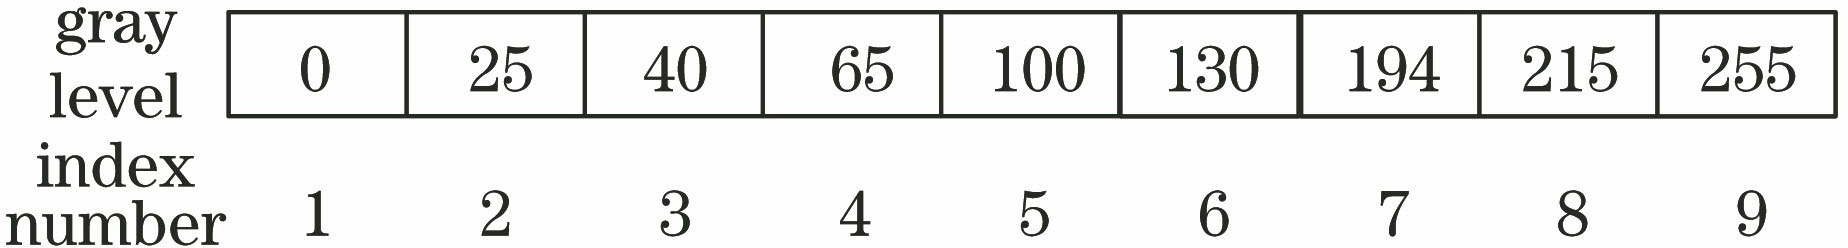
Fig. 1. Schematic of chromosome structure
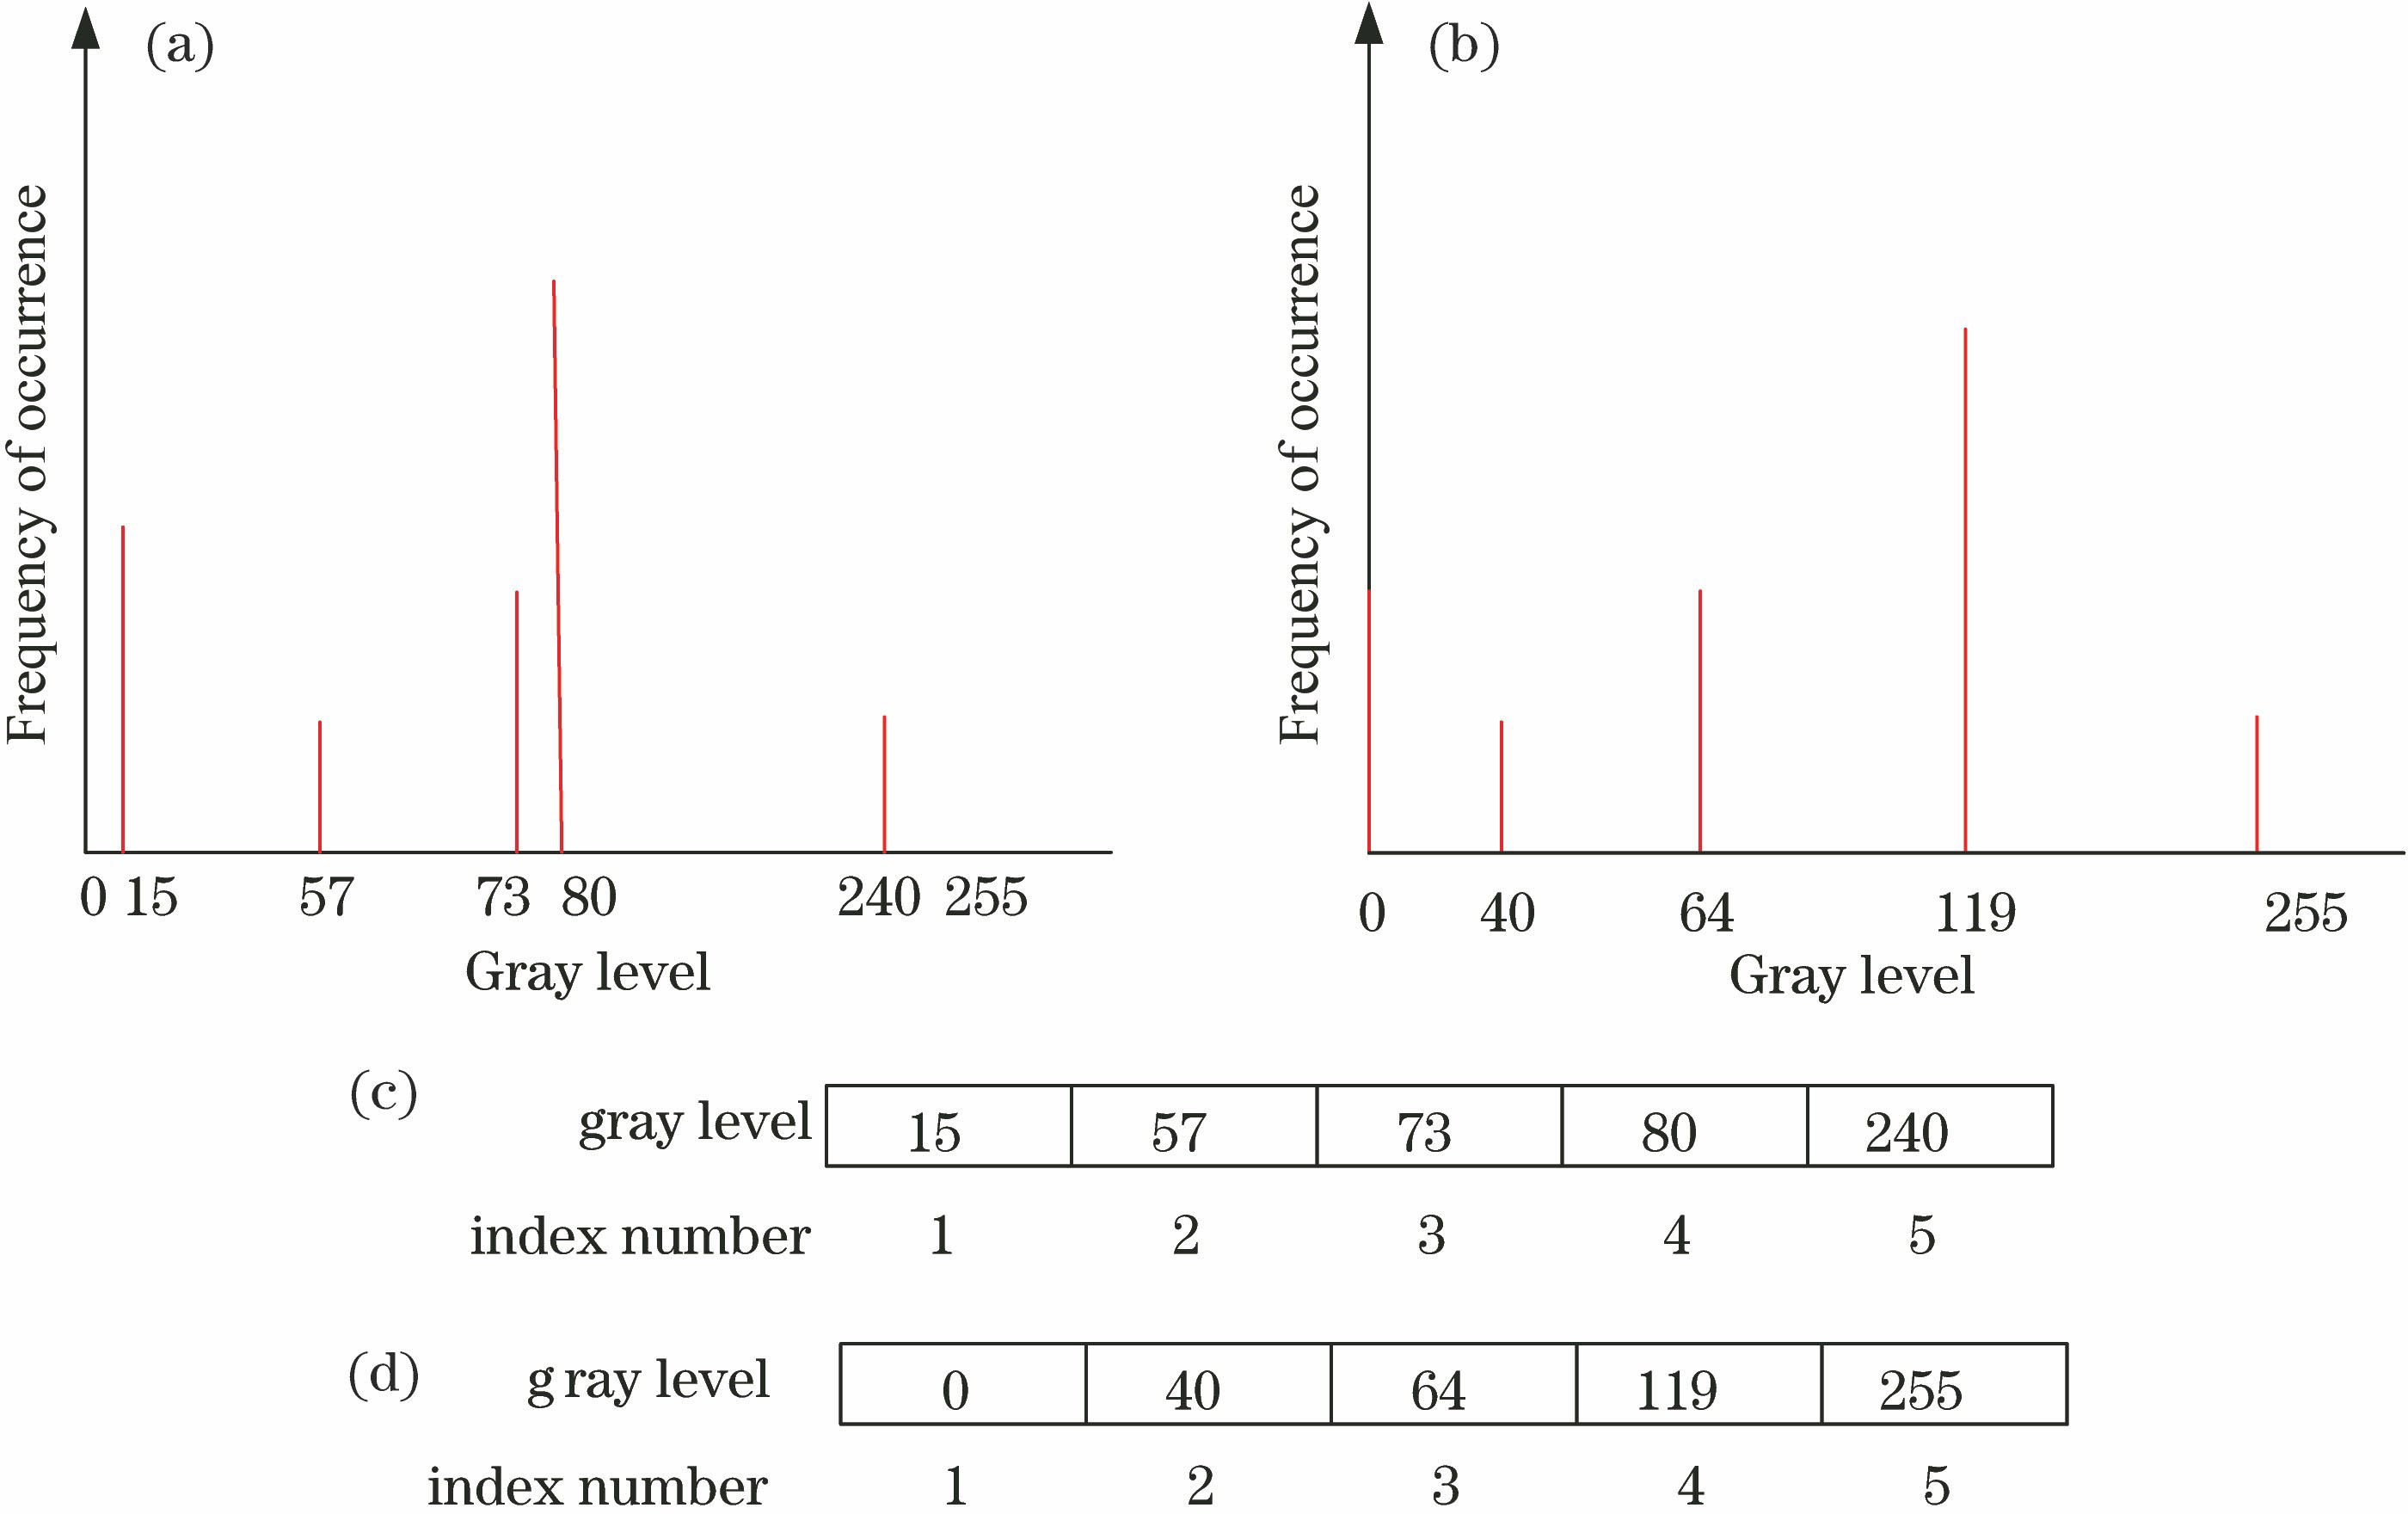
Fig. 2. Schematics of chromosome structure before and after mapping. (a) Distribution of gray value of original image; (b) gray value distribution of remapped image; (c) original chromosome structure; (d) remapped chromosome structure
Fig. 3. Flowchart of SCBSO algorithm
Fig. 4. Image enhancement method for simple chromosome structure of SCBSO
Fig. 5. Iterative curves of four algorithms for f 1(x ) function
Fig. 6. Iterative curves of four algorithms for f 2(x ) function
Fig. 7. Image collected in database
Fig. 8. Image extracted in ROI
Fig. 9. Experimental image 1 enhanced by different algorithms. (a) Enhanced image of original image; (b) image enhanced by BSO; (c) image enhanced by GA; (d) image enhanced by SCBSO
Fig. 10. Gray histograms of images enhanced by different algorithms. (a) Gray histogram of original image; (b) gray histogram enhanced by BSO; (c) gray histogram enhanced by GA; (d) gray histogram enhanced by SCBSO
Fig. 11. Experimental image 2 enhanced by different algorithms. (a) Original image; (b) image enhanced by BSO; (c) image enhanced by GA; (d) image enhanced by SCBSO
Fig. 12. Gray histograms of image 2 enhanced by different algorithms. (a) Gray histogram of original image; (b) gray histogram enhanced by BSO; (c) gray histogram enhanced by GA; (d) gray histogram enhanced by SCBSO
|
Table 1. Results of benchmark function test
|
Table 2. Comparison of function performances of different algorithms
|
Table 3. Objective evaluation index of images enhanced by different algorithms
|
Table 4. Average indexes of different methods on 40 images

Set citation alerts for the article
Please enter your email address
© Copyright 2018-2021 | Chinese Laser Press. All Rights Reserved 沪ICP备15018463号-20