Author Affiliations
1Key Laboratory of Optical Calibration and Characterization, Anhui Institute of Optics and Fine Mechanics, Chinese Academy of Sciences, Hefei, Anhui 230031, China2University of Science and Technology of China, Hefei, Anhui 230026, Chinashow less
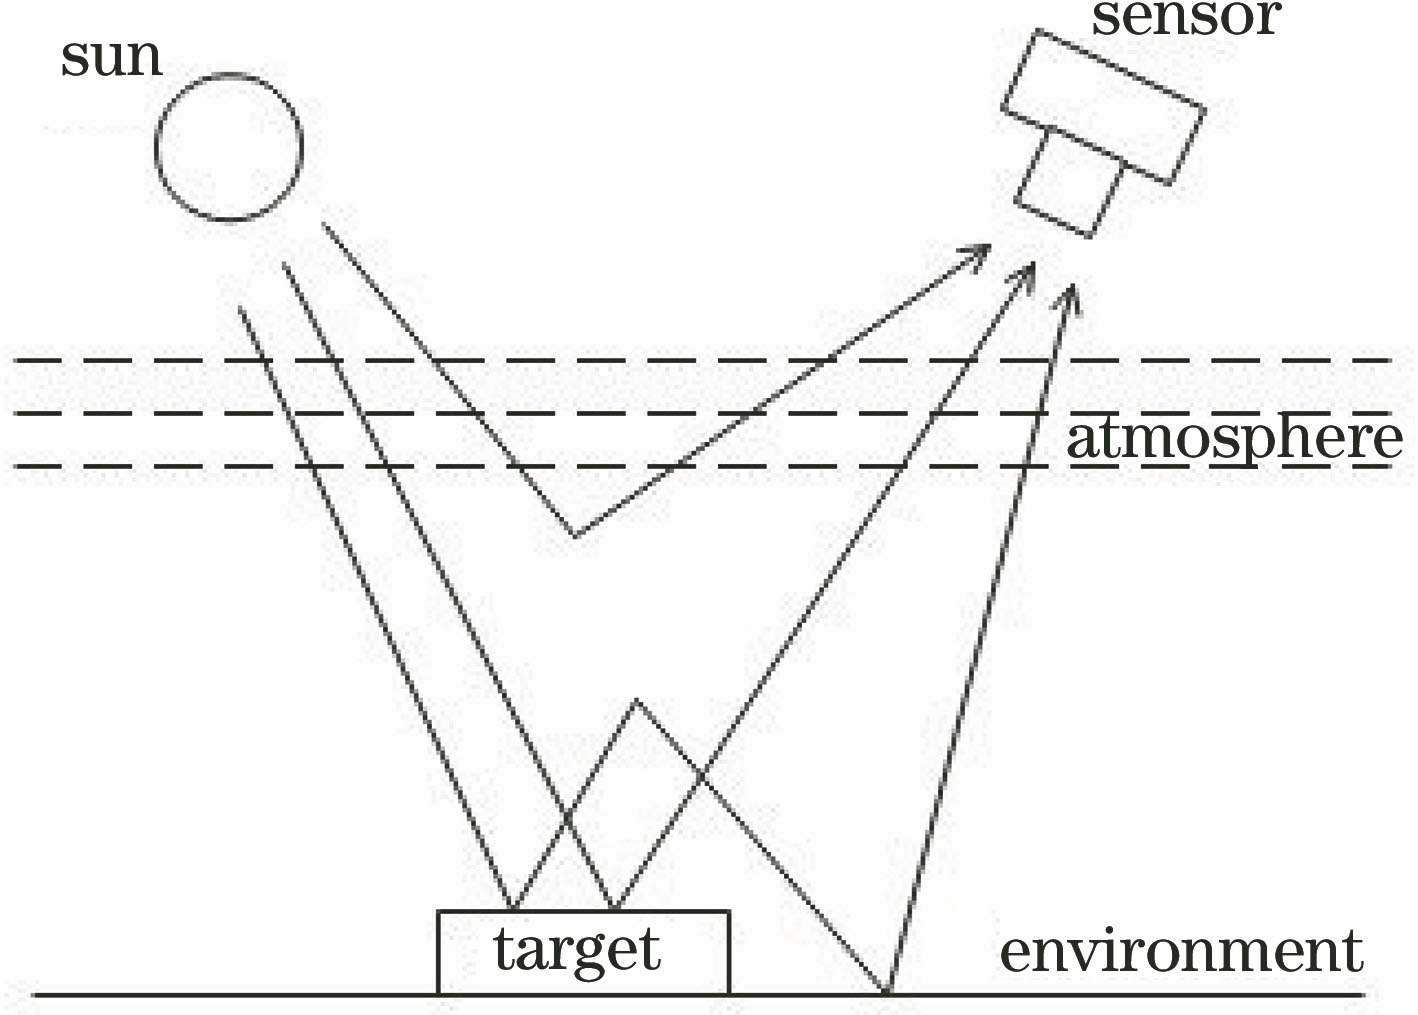
Fig. 1. Schematic of sun, target and sensor's reciprocity
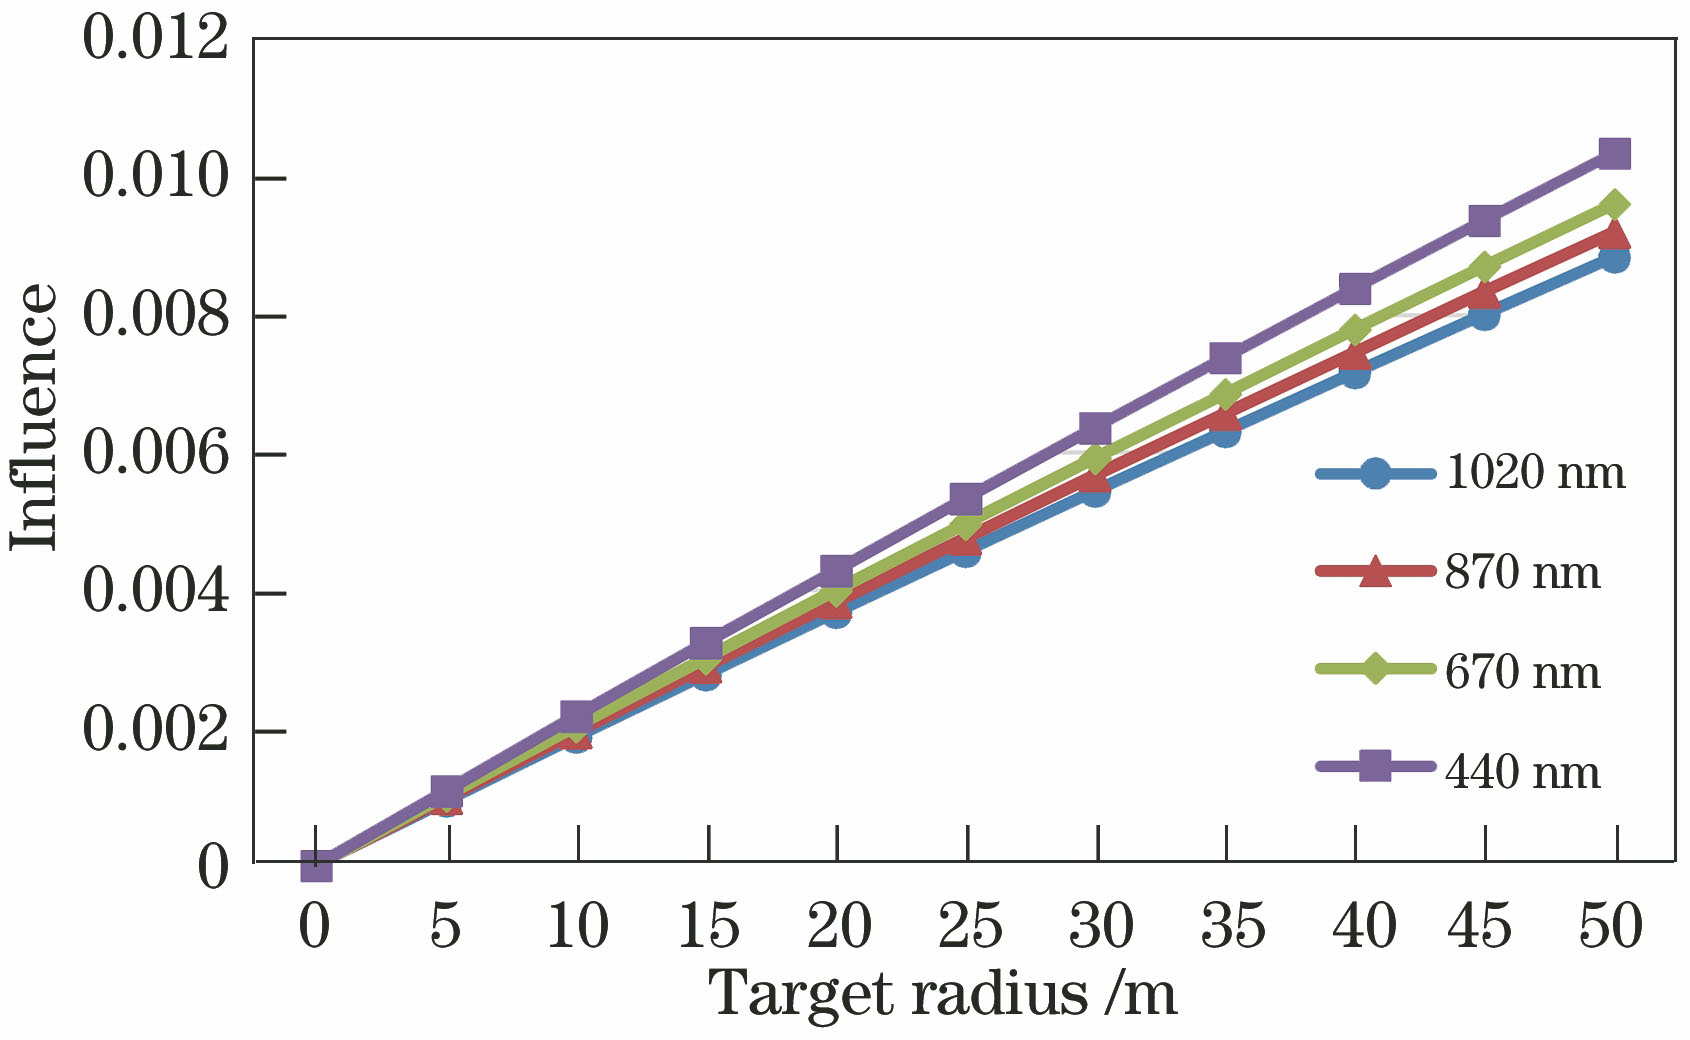
Fig. 2. Influence of adjacency effect between target and environment when AOT is 0.15
Fig. 3. Influence of adjacency effect between target and environment when AOT is 0.3
Fig. 4. Schematic of target laying
Fig. 5. Target reflectance
Fig. 6. Reflectance-digital number fitting curve on August 18
Fig. 7. Reflectance-digital number fitting curve on August 22
Fig. 8. Reflectance-digital number fitting curve on September 12
Fig. 9. Reflectance of color target reflectance
| Wavelength /nm | Target reflectance | <ρ(M)> | <ρ'(M)> | Relative deviation /% |
|---|
| 60% | 0.169011 | 0.168476 | 0.316884 | | 40% | 0.166188 | 0.165146 | 0.628609 | | 440 | 20% | 0.161831 | 0.161817 | 0.008710 | | 5% | 0.159441 | 0.159319 | 0.076292 | | 60% | 0.266634 | 0.266117 | 0.193973 | | 40% | 0.261788 | 0.260687 | 0.421173 | | 670 | 20% | 0.254559 | 0.255258 | -0.274280 | | 5% | 0.250898 | 0.251186 | -0.114580 | | 60% | 0.274963 | 0.274420 | 0.197776 | | 40% | 0.269556 | 0.268385 | 0.435242 | | 870 | 20% | 0.261511 | 0.262350 | -0.320310 | | 5% | 0.257462 | 0.257824 | -0.140280 | | 60% | 0.282148 | 0.281618 | 0.188101 | | 40% | 0.276555 | 0.275399 | 0.419138 | | 1020 | 20% | 0.268255 | 0.269180 | -0.344330 | | 5% | 0.264102 | 0.264516 | -0.156430 |
|
Table 1. Influence of surrounding targets
| Band | Calibration coefficient | Relativestandarddeviation /% |
|---|
| Aug. 18 | Sept. 20 | Aug. 22 |
|---|
| Band 1 | 2.637748 | 2.595359 | 2.601729 | 0.875 | | Band 2 | 3.357519 | 3.288545 | 3.290493 | 1.186 | | Band 3 | 2.979735 | 2.946425 | 2.999565 | 0.903 | | Band 4 | 3.452361 | 3.430652 | 3.406411 | 0.670 |
|
Table 2. Calibration coefficient calculated by gray-scale targets method
| Band | Gray-scaletargets methodcalibrationcoefficient onSept. 20 | Large uniformsite methodcalibrationcoefficient onSept. 20 | Relativedeviation /% |
|---|
| Band 1 | 2.595359 | 2.967985 | 13.396 | | Band 2 | 3.288545 | 3.63666 | 10.054 | | Band 3 | 2.946425 | 3.223276 | 8.975 | | Band 4 | 3.430652 | 3.746692 | 8.807 |
|
Table 3. Calibration coefficients calculated by large uniform site method and gray-scale targets method
| Band | Gray-scale targets methodcalibration coefficient on Sept. 20 | Large uniform site method calibrationcoefficient on Sept. 20 (after correction) | Relativedeviation /% |
|---|
| Band 1 | 2.595359 | 2.609543 | 0.545 | | Band 2 | 3.288545 | 3.349324 | 1.831 | | Band 3 | 2.946425 | 3.005511 | 1.985 | | Band 4 | 3.430652 | 3.497758 | 1.937 |
|
Table 4. Comparison of calibration coefficients obtained by two methods
| Uncertainty factor | Relativeuncertainty /% |
|---|
| Calculation of total ground irradiance | 3 | | Target BRDF measurement | 2 | | Calculation of upward transmittance | 2 | | Adjacency effect calculation | 1 | | Others (geometric factors, etc.) | 1 | | Comprehensive uncertainty | 4.4 |
|
Table 5. Uncertainty analysis of gray-scale targets method
| Band | Red target | Absolutedifference | Green target | Absolutedifference |
|---|
| Inversion | Measurement | Inversion | Measurement |
|---|
| Band 1 | 0.047843 | 0.050505 | 0.00266 | 0.268581 | 0.277531 | 0.00895 | | Band 2 | 0.042354 | 0.049642 | 0.00729 | 0.209395 | 0.213367 | 0.00397 | | Band 3 | 0.568769 | 0.565991 | 0.00278 | 0.061904 | 0.062679 | 0.00078 | | Band 4 | 0.663567 | 0.654416 | 0.00915 | 0.196434 | 0.198960 | 0.00253 |
|
Table 6. Comparison of reflectance inversion results