
Yi Yang, Yan Liu, Yilong Wang, Jianlei Zhang, Fangming Yang. Influence of underwater composite channel on performance of GMSK wireless optical communication system[J]. Infrared and Laser Engineering, 2022, 51(6): 20210622
- Infrared and Laser Engineering
- Vol. 51, Issue 6, 20210622 (2022)
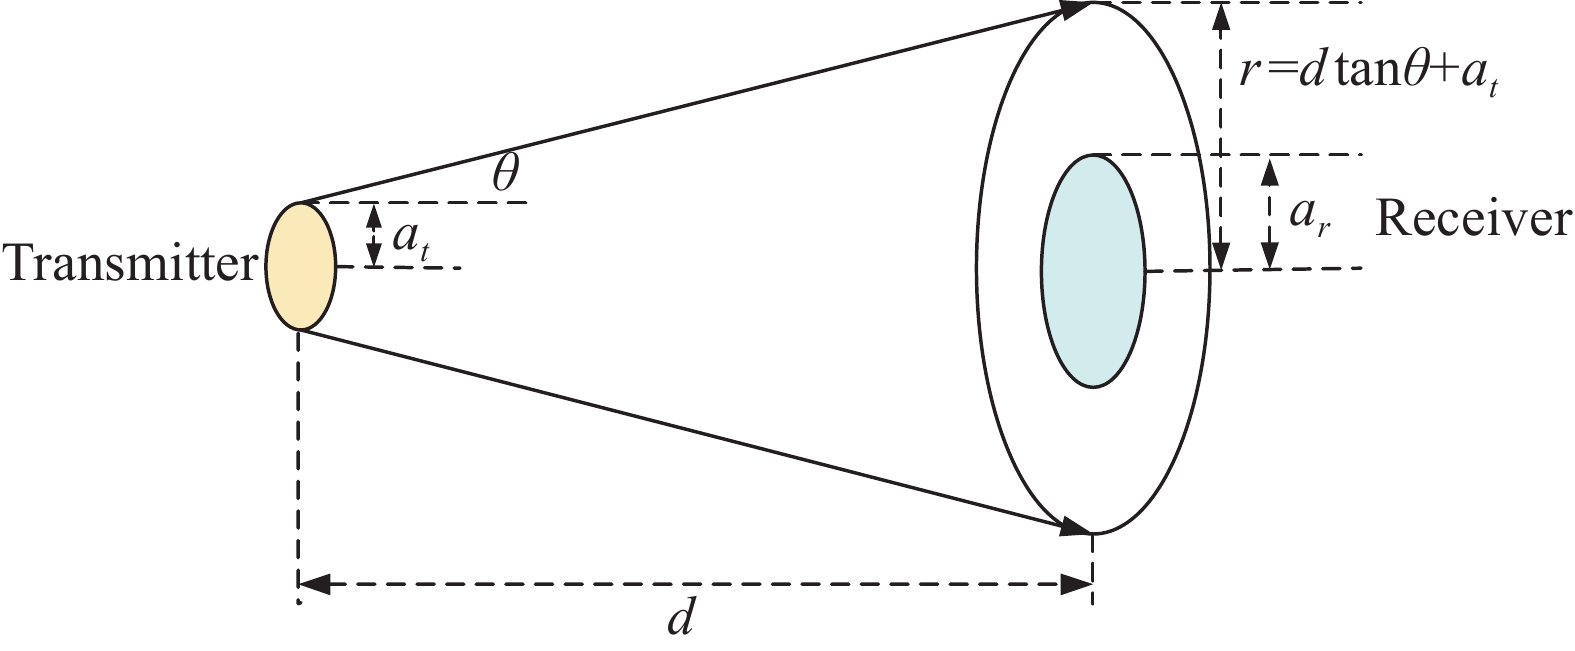
Fig. 1. Beam spread diagram
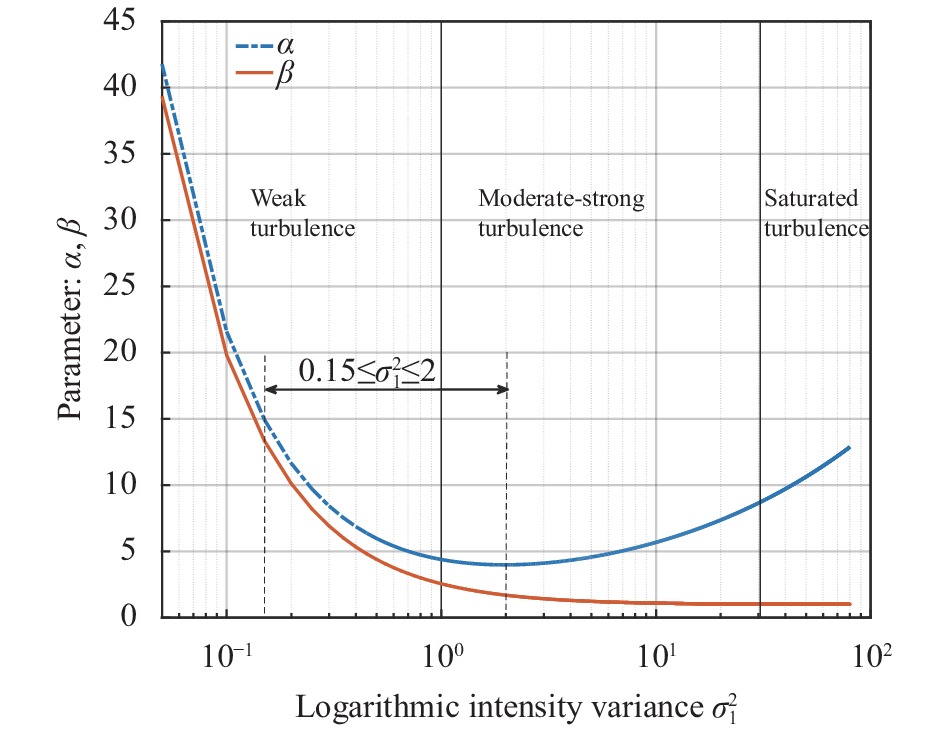
Fig. 2. Values of α and β in different turbulent regions
不同湍流区域的
和
值
Fig. 3. (a)
=0.5 Gamma-Gamma probability density function and Gaussian distribution function; (b) Gamma-Gamma random noise distribution of different logarithmic intensity variances
(a)
=0.5 Gamma-Gamma概率密度函数和高斯分布函数;(b) 不同对数强度方差的Gamma-Gamma分布随机噪声直方图
Fig. 4. Block diagram of GMSK signal modulation
Fig. 5. Block diagram of GMSK demodulation
Fig. 6. Underwater wireless optical communication system
Fig. 7. (a) Waveform of GMSK modulated optical signal through channel; (b) Comparison of signal waveform before and after SNR =10 dB demodulation
Fig. 8. (a) Comparison of BER performance of OOK modulation, PPM modulation and GMSK modulation in attenuation channels; (b) Comparison of BER performance of OOK modulation, PPM modulation and GMSK modulation in composite channels
Fig. 9. Comparison of system BER performance of GMSK modulation in composite channels with different turbulence logarithmic intensities variance
Fig. 10. Relationship between different transmission distances and SNR in composite channel
Fig. 11. Relationship between turbulence logarithmic intensity variance and limit BER in composite channel
|
Table 1. Absorption, scattering and attenuation coefficients of different water qualities
|
Table 2. System parameters

Set citation alerts for the article
Please enter your email address
© Copyright 2018-2021 | Chinese Laser Press. All Rights Reserved 沪ICP备15018463号-20