• Photonics Research
  • Vol. 5, Issue 6, B34 (2017)
Simon J. Herr1, Karsten Buse1、2, and Ingo Breunig1、2、*
Author Affiliations
  • 1Laboratory for Optical Systems, Department of Microsystems Engineering, University of Freiburg, Georges-K?hler-Allee 102, 79110 Freiburg, Germany
  • 2Fraunhofer Institute for Physical Measurement Techniques IPM, Heidenhofstra?e 8, 79110 Freiburg, Germany
  • show less
    DOI: 10.1364/PRJ.5.000B34 Cite this Article Set citation alerts
    Simon J. Herr, Karsten Buse, Ingo Breunig. LED-pumped whispering-gallery laser[J]. Photonics Research, 2017, 5(6): B34 Copy Citation Text show less
    Blue: measured absorption coefficient of Nd:YVO4 for o- and e-polarized light αo and αe, respectively. Orange: normalized intensity profile of the LED at its maximum specified cw current of 0.8 A during cw operation, and normalized intensity profile of the WGR-laser emission in pulsed operation and an LED driving current >0.92 A.
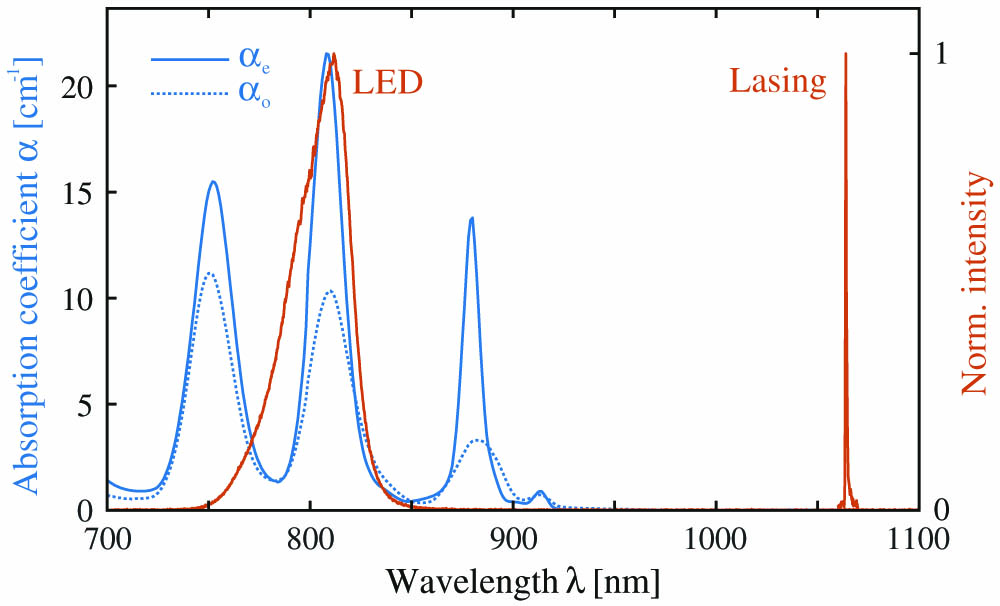
    Fig. 1. Blue: measured absorption coefficient of Nd:YVO4 for o- and e-polarized light αo and αe, respectively. Orange: normalized intensity profile of the LED at its maximum specified cw current of 0.8 A during cw operation, and normalized intensity profile of the WGR-laser emission in pulsed operation and an LED driving current >0.92  A.
    (a) LED directly illuminates a laser-active WGR made out of z-cut Nd:YVO4. Silicone oil serves as an immersion fluid to guide the light from the LED to the WGR. Evanescent coupling via a coupling prism extracts two counter-propagating laser beams stemming from the bidirectional lasing in WGMs. A detector (Pl) measures the laser output power. (b) Photograph of the experimental setup. The active area of the LED and the prism are highlighted. For the sake of recognizability, the prism is moved away from the resonator. (c) Illustration of the polar and the radial extents hm and wm of the WGMs, respectively.
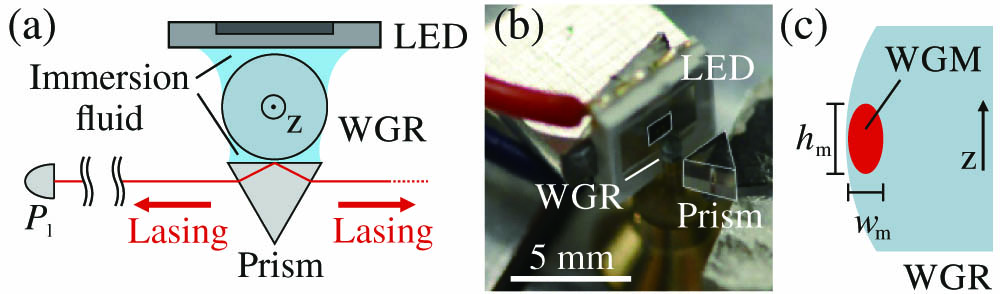
    Fig. 2. (a) LED directly illuminates a laser-active WGR made out of z-cut Nd:YVO4. Silicone oil serves as an immersion fluid to guide the light from the LED to the WGR. Evanescent coupling via a coupling prism extracts two counter-propagating laser beams stemming from the bidirectional lasing in WGMs. A detector (Pl) measures the laser output power. (b) Photograph of the experimental setup. The active area of the LED and the prism are highlighted. For the sake of recognizability, the prism is moved away from the resonator. (c) Illustration of the polar and the radial extents hm and wm of the WGMs, respectively.
    Output power during a 100-μs-long excitation pulse. A low driving current of the LED yields fluorescent light. Above a threshold, laser spiking occurs, and the peak power is increasing rapidly with increasing current.
    Fig. 3. Output power during a 100-μs-long excitation pulse. A low driving current of the LED yields fluorescent light. Above a threshold, laser spiking occurs, and the peak power is increasing rapidly with increasing current.
    Output peak power for 100-μs-long excitation pulses at different coupling strengths. Stronger coupling yields a higher laser output at an increased laser threshold compared to the case of weaker coupling. First laser spikes occur at 0.92 and 1.03 A. The insets illustrate the unpolarized emission below threshold and the e-polarized emission above the laser threshold. The pixel size is 2.2 μm×2.2 μm.
    Fig. 4. Output peak power for 100-μs-long excitation pulses at different coupling strengths. Stronger coupling yields a higher laser output at an increased laser threshold compared to the case of weaker coupling. First laser spikes occur at 0.92 and 1.03 A. The insets illustrate the unpolarized emission below threshold and the e-polarized emission above the laser threshold. The pixel size is 2.2  μm×2.2  μm.
    (a) Output power during a 100-ms-long excitation pulse for different LED driving currents. Below 0.9 A, only fluorescent light is detected. Above 0.9 A, laser oscillation starts. (b) The blue data points indicate the maximum power of the pulse versus peak current. The red data points represent the end value, averaged over the last 10 ms of the pulse.
    Fig. 5. (a) Output power during a 100-ms-long excitation pulse for different LED driving currents. Below 0.9 A, only fluorescent light is detected. Above 0.9 A, laser oscillation starts. (b) The blue data points indicate the maximum power of the pulse versus peak current. The red data points represent the end value, averaged over the last 10 ms of the pulse.
    Simon J. Herr, Karsten Buse, Ingo Breunig. LED-pumped whispering-gallery laser[J]. Photonics Research, 2017, 5(6): B34
    Download Citation