
Hou Chunping, Jiang Tianli, Lang Yue, Yang Yang. Human Activity and IdentityMulti-Task Recognition Based on Convolutional Neural Network Using Doppler Radar[J]. Laser & Optoelectronics Progress, 2020, 57(2): 21009
- Laser & Optoelectronics Progress
- Vol. 57, Issue 2, 21009 (2020)
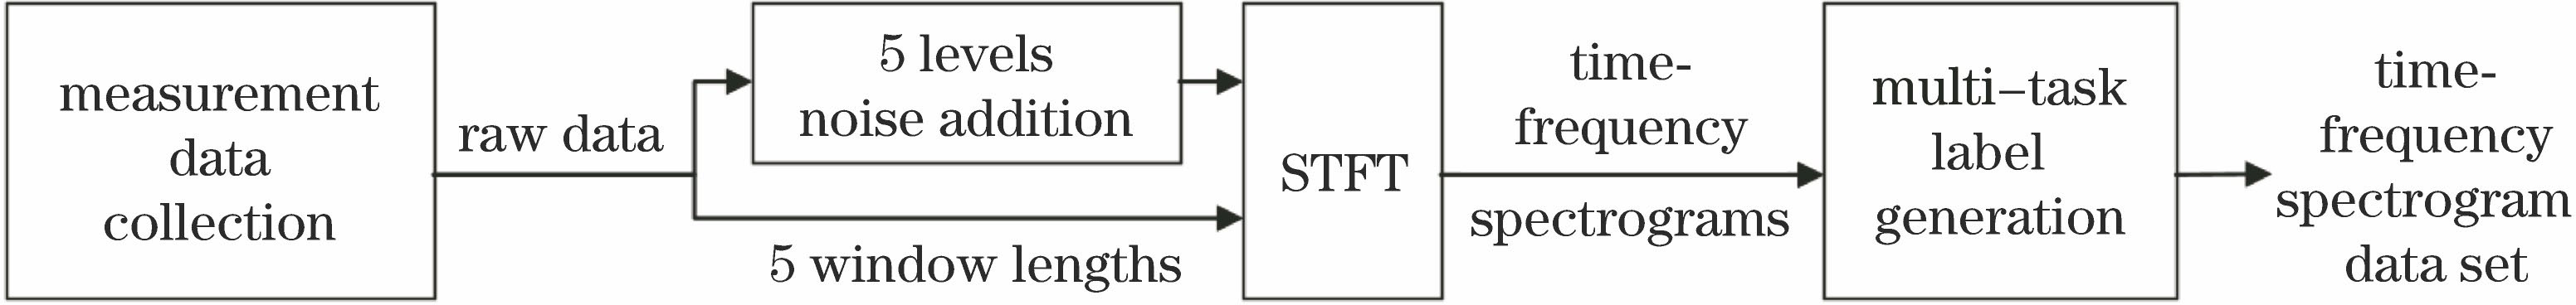
Fig. 1. Flow chart of building radar time-frequency image data set
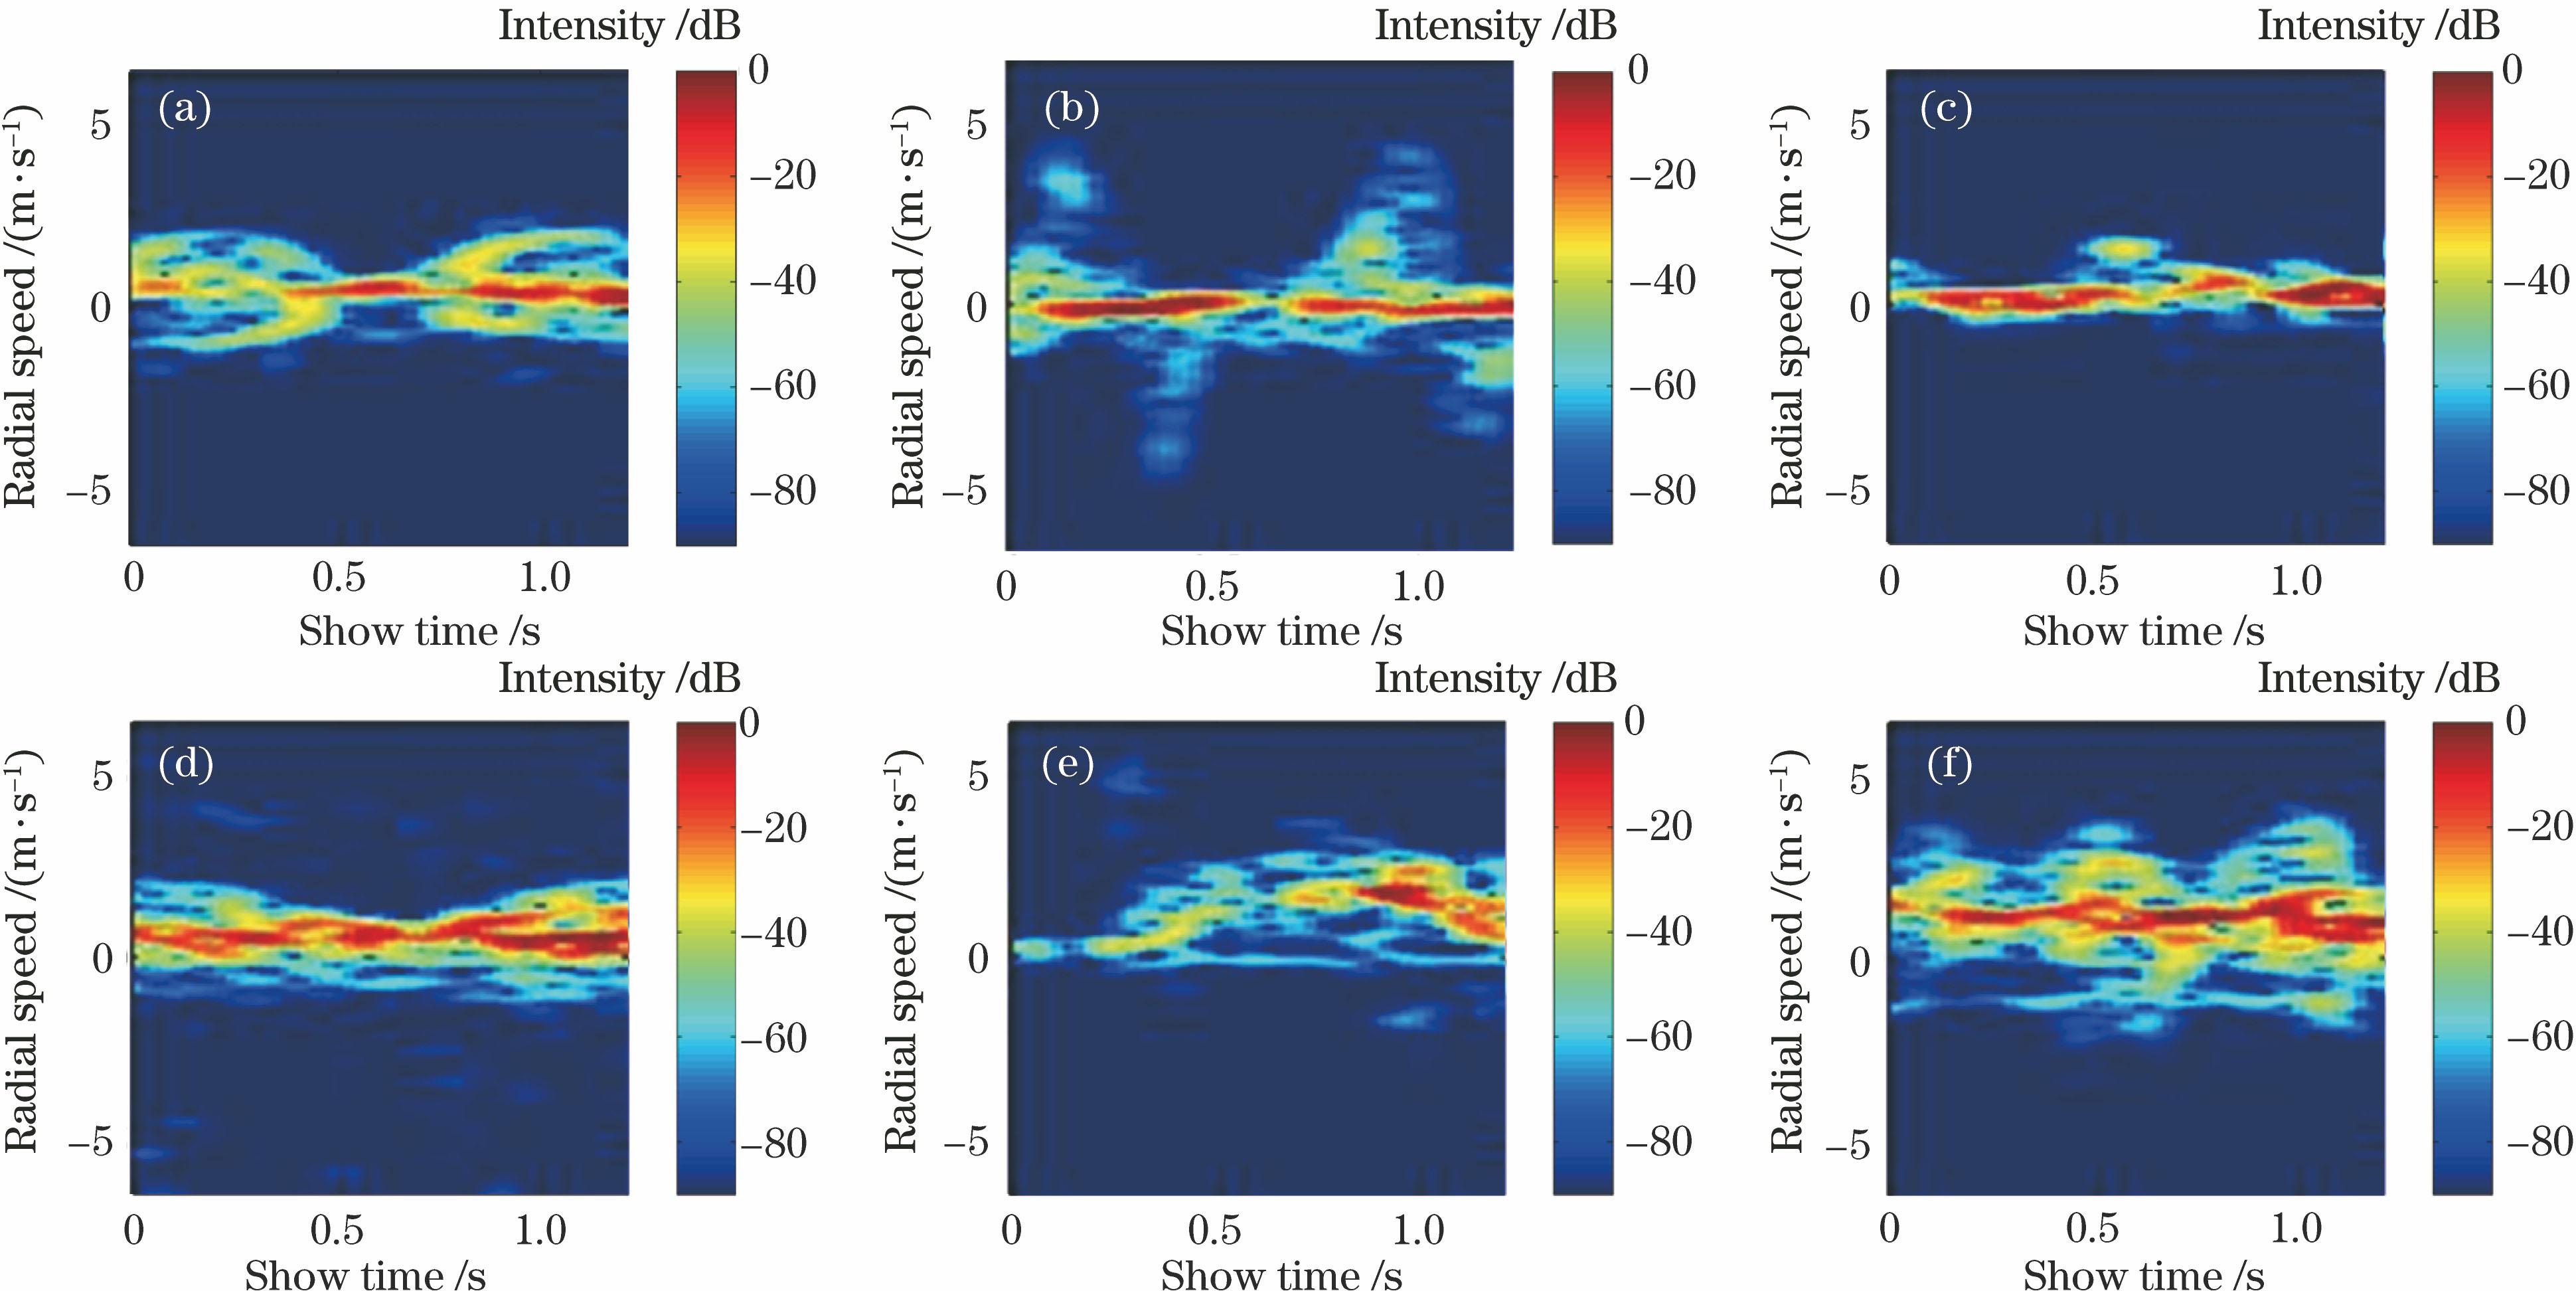
Fig. 2. Radar time-frequency spectrograms of radar for six human activities. (a) Walking; (b) boxing; (c) crawling on the ground; (d) diving; (e) standing forward and jumping; (f) running
Fig. 3. Structural diagram of SE module
Fig. 4. Multi-task recognition model structure based on CNN
Fig. 5. Diagram of joint loss function generation
Fig. 6. Loss and accuracy curves. (a) Loss curves; (b) accuracy curves
| ||||||||||||||||||||||||||||||||||||||||||||||||
Table 1. Results of multi-task and single-task recognitions
| |||||||||||||||||||
Table 2. Recognition results of different network structures
| |||||||||||||||||||
Table 3. Recognition results of different loss optimization
| |||||||||||||||||||||||
Table 4. Recognition results under different STFT window lengths
| |||||||||||||||||||||||||||
Table 5. Recognition results under different NSR
| |||||||||||||||||||||||||||||||
Table 6. Recognition results under different training data sizes
| |||||||||||||||||||
Table 7. Comparison of results of algorithms

Set citation alerts for the article
Please enter your email address
© Copyright 2018-2021 | Chinese Laser Press. All Rights Reserved 沪ICP备15018463号-20