
Wenhai Yu, Di Feng, Ri Liang, Ningfang Song. Polarization Axis Detection Technique of Polarization Maintaining Fiber Based on Symmetry Evaluation[J]. Acta Optica Sinica, 2019, 39(2): 0211001
- Acta Optica Sinica
- Vol. 39, Issue 2, 0211001 (2019)
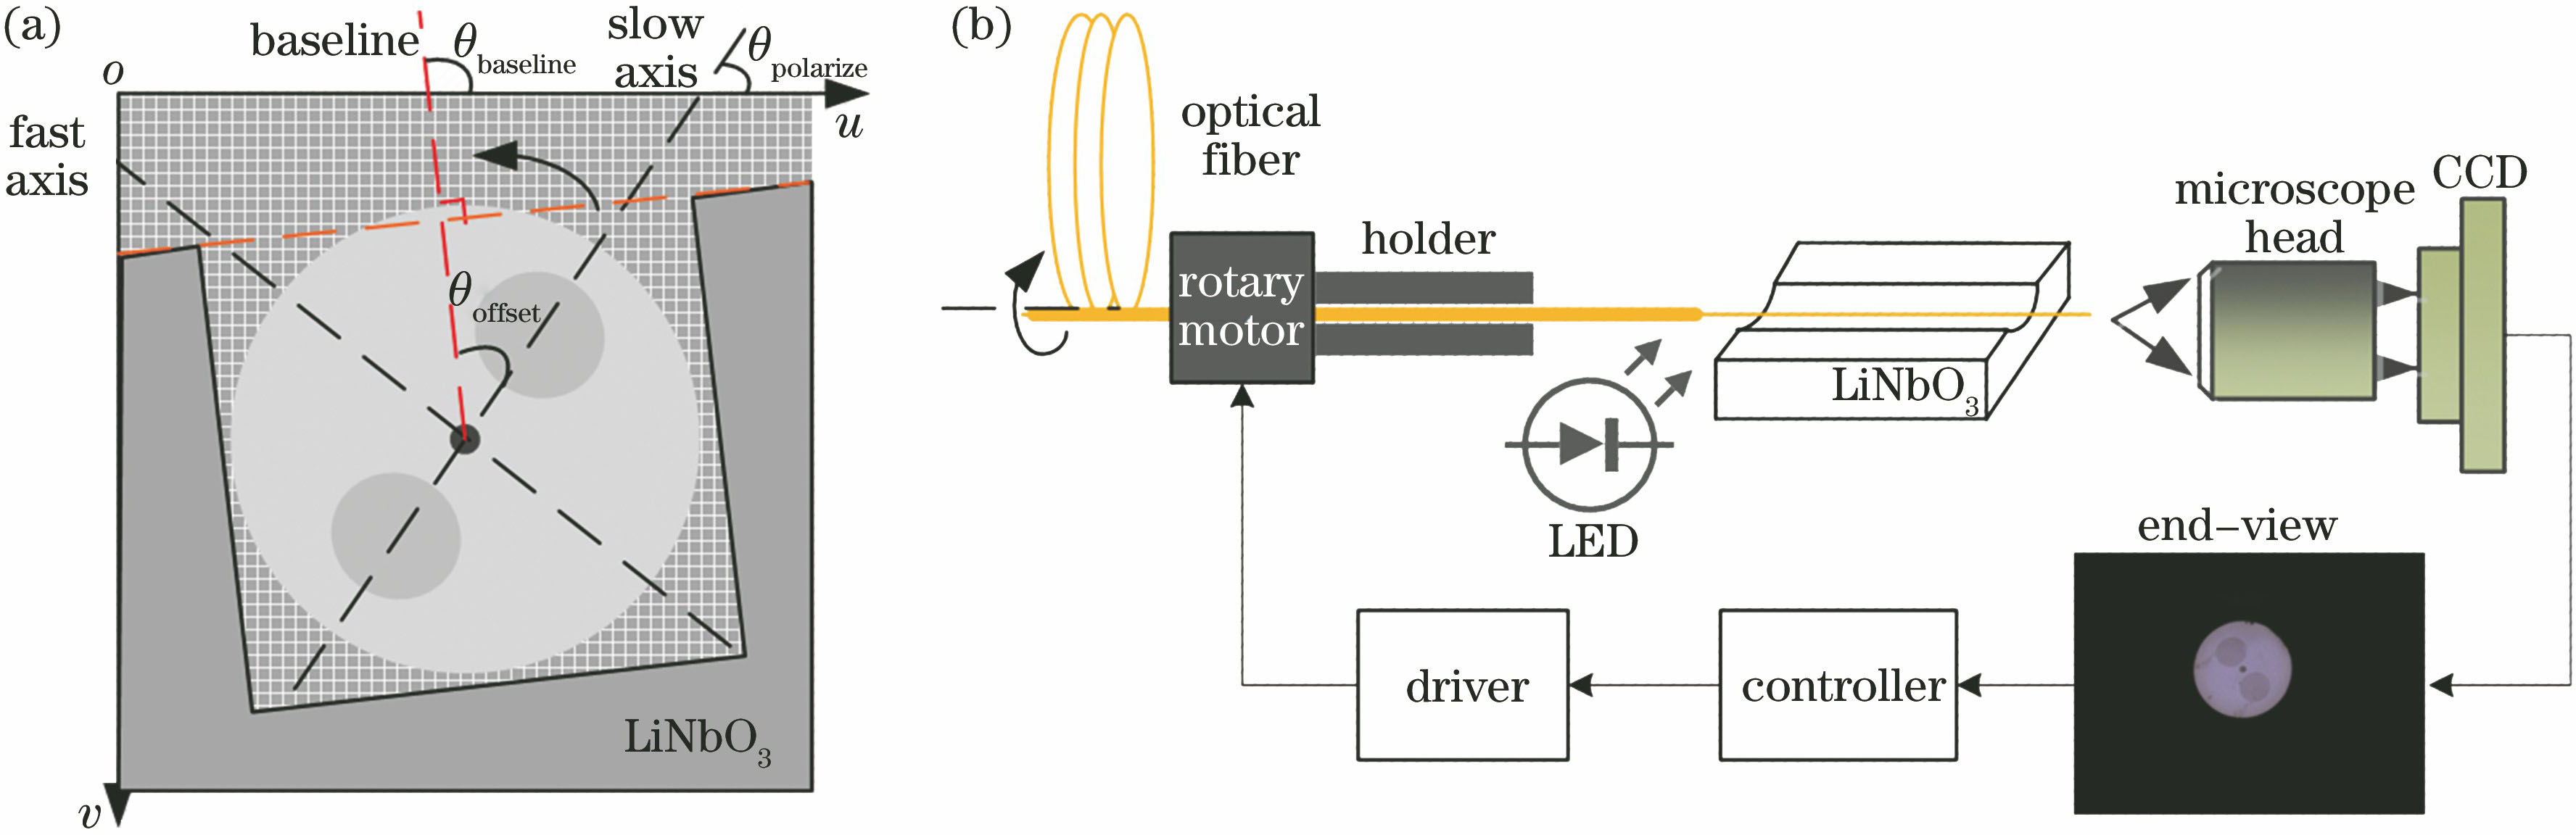
Fig. 1. Schematic of polarization alignment of PMF. (a) Axis-fixed process; (b) axis-fixed system
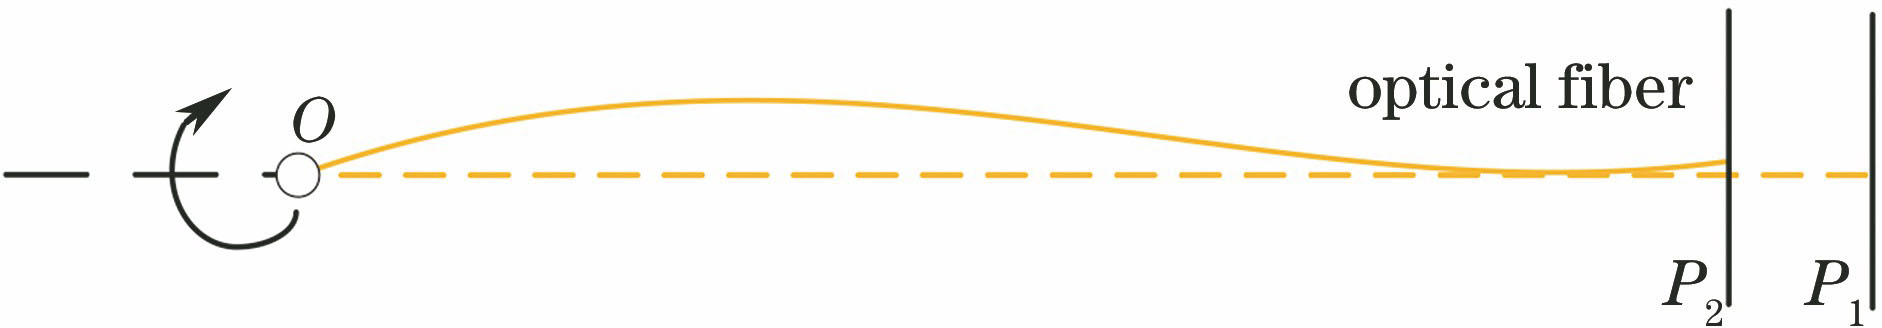
Fig. 2. Front-back creeping phenomenon of end face during fiber rotation
Fig. 3. Transformation of coordinate system. (a) Original image; (b) transformed image
Fig. 4. Coordinate transformation of actual image. (a) Original image; (b) transformed image
Fig. 5. Steps for symmetry evaluation (θ=l)
Fig. 6. Schematic of steps for pyramid searching
Fig. 7. Actual image of fiber end face
Fig. 8. Six groups of simulated image samples. (a) Group A; (b) group B; (c) group C; (d) group D; (e) group E; (f) group F
Fig. 9. Detection results of six groups of images
Fig. 10. Detection results for two algorithms under different lighting conditions. (a) Good lighting condition; (b) medium lighting condition; (c) poor lighting condition
Fig. 11. Detection results for two algorithms under different defocus distances. (a) 20 μm; (b) 40 μm; (c) 60 μm
|
Table 1. Size of fiber end face
|
Table 2. Parameters of fiber end face for six sets of images
| ||||||||||||||||||||||||||||||||||||||
Table 3. Standard deviation comparison between SRP and SE algorithms

Set citation alerts for the article
Please enter your email address
© Copyright 2018-2021 | Chinese Laser Press. All Rights Reserved 沪ICP备15018463号-20