
Yinghua Zhang, Ang Li, Pinhua Xie, Lei Yang, Jin Xu, Chaogang Zhang, Zhaokun Hu. Influence of Filter on Column density of Polluted Gas in Non-Dispersive Imaging System[J]. Acta Optica Sinica, 2019, 39(2): 0212001
- Acta Optica Sinica
- Vol. 39, Issue 2, 0212001 (2019)
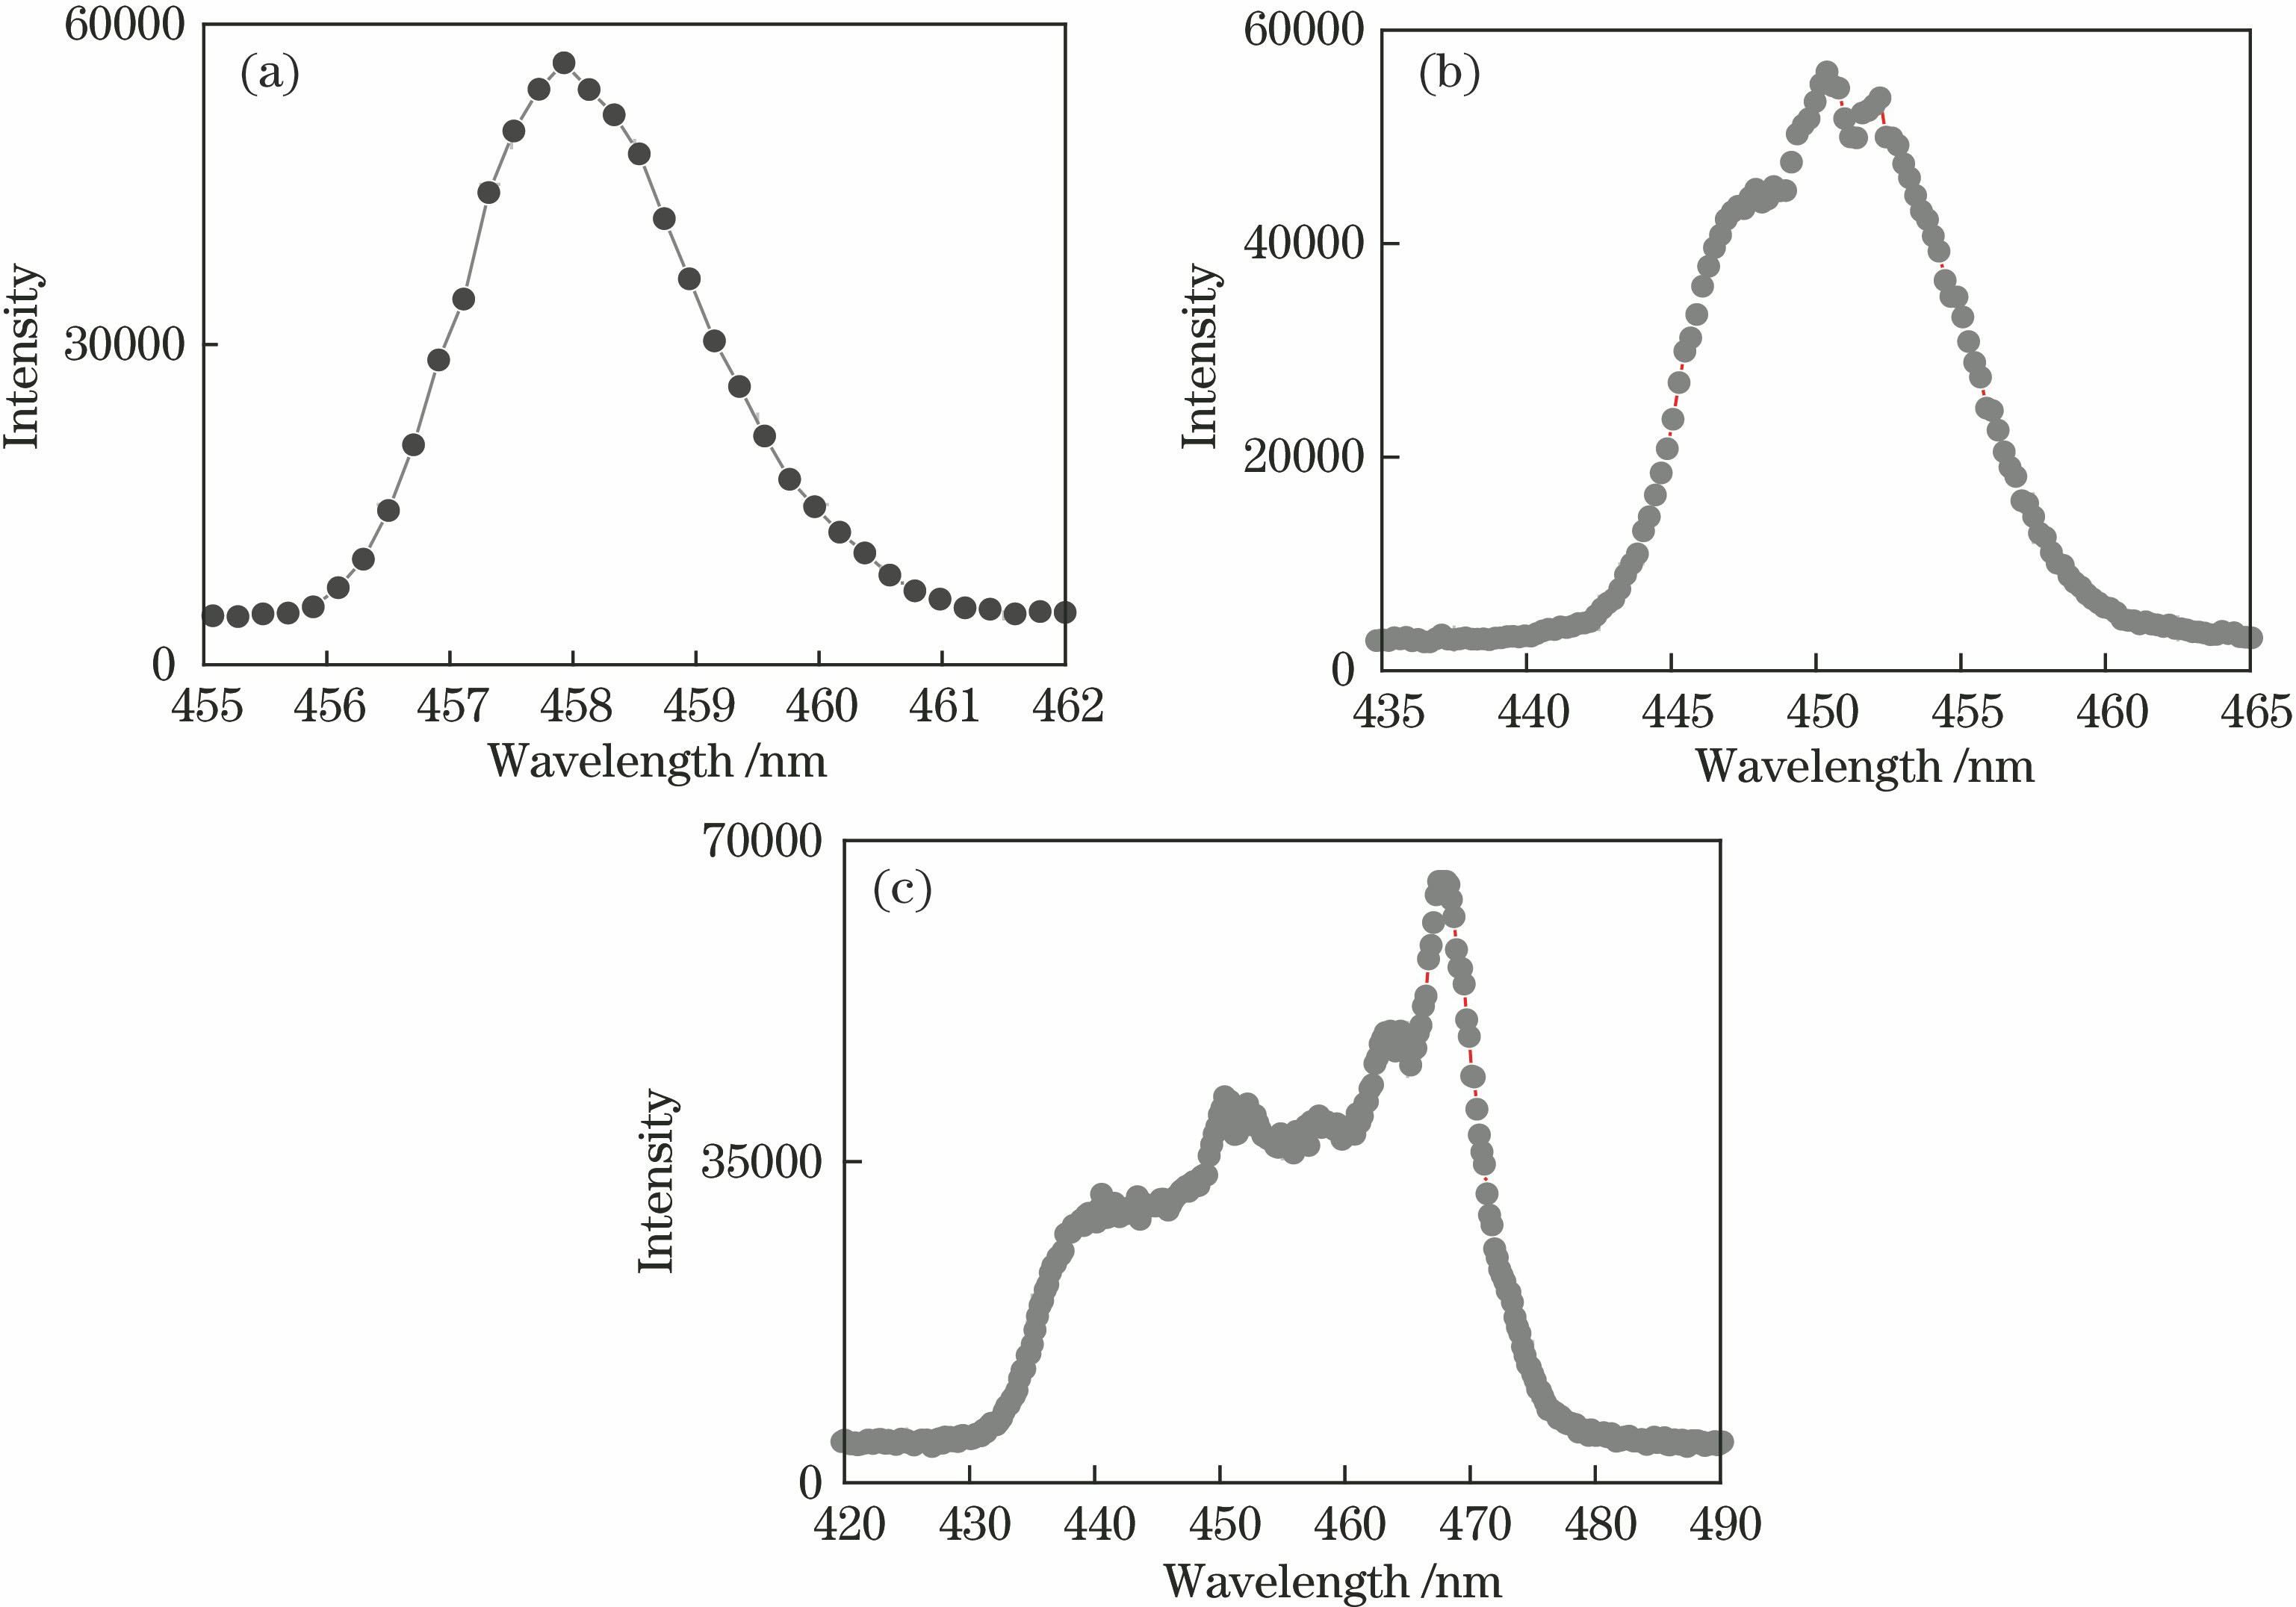
Fig. 1. Transmittance peak types and wavelength ranges of different band-pass filters. (a) λc=458 nm, w1/2=2 nm; (b) λc=450 nm, w1/2=10 nm; (c) λc=450 nm, w1/2=40 nm
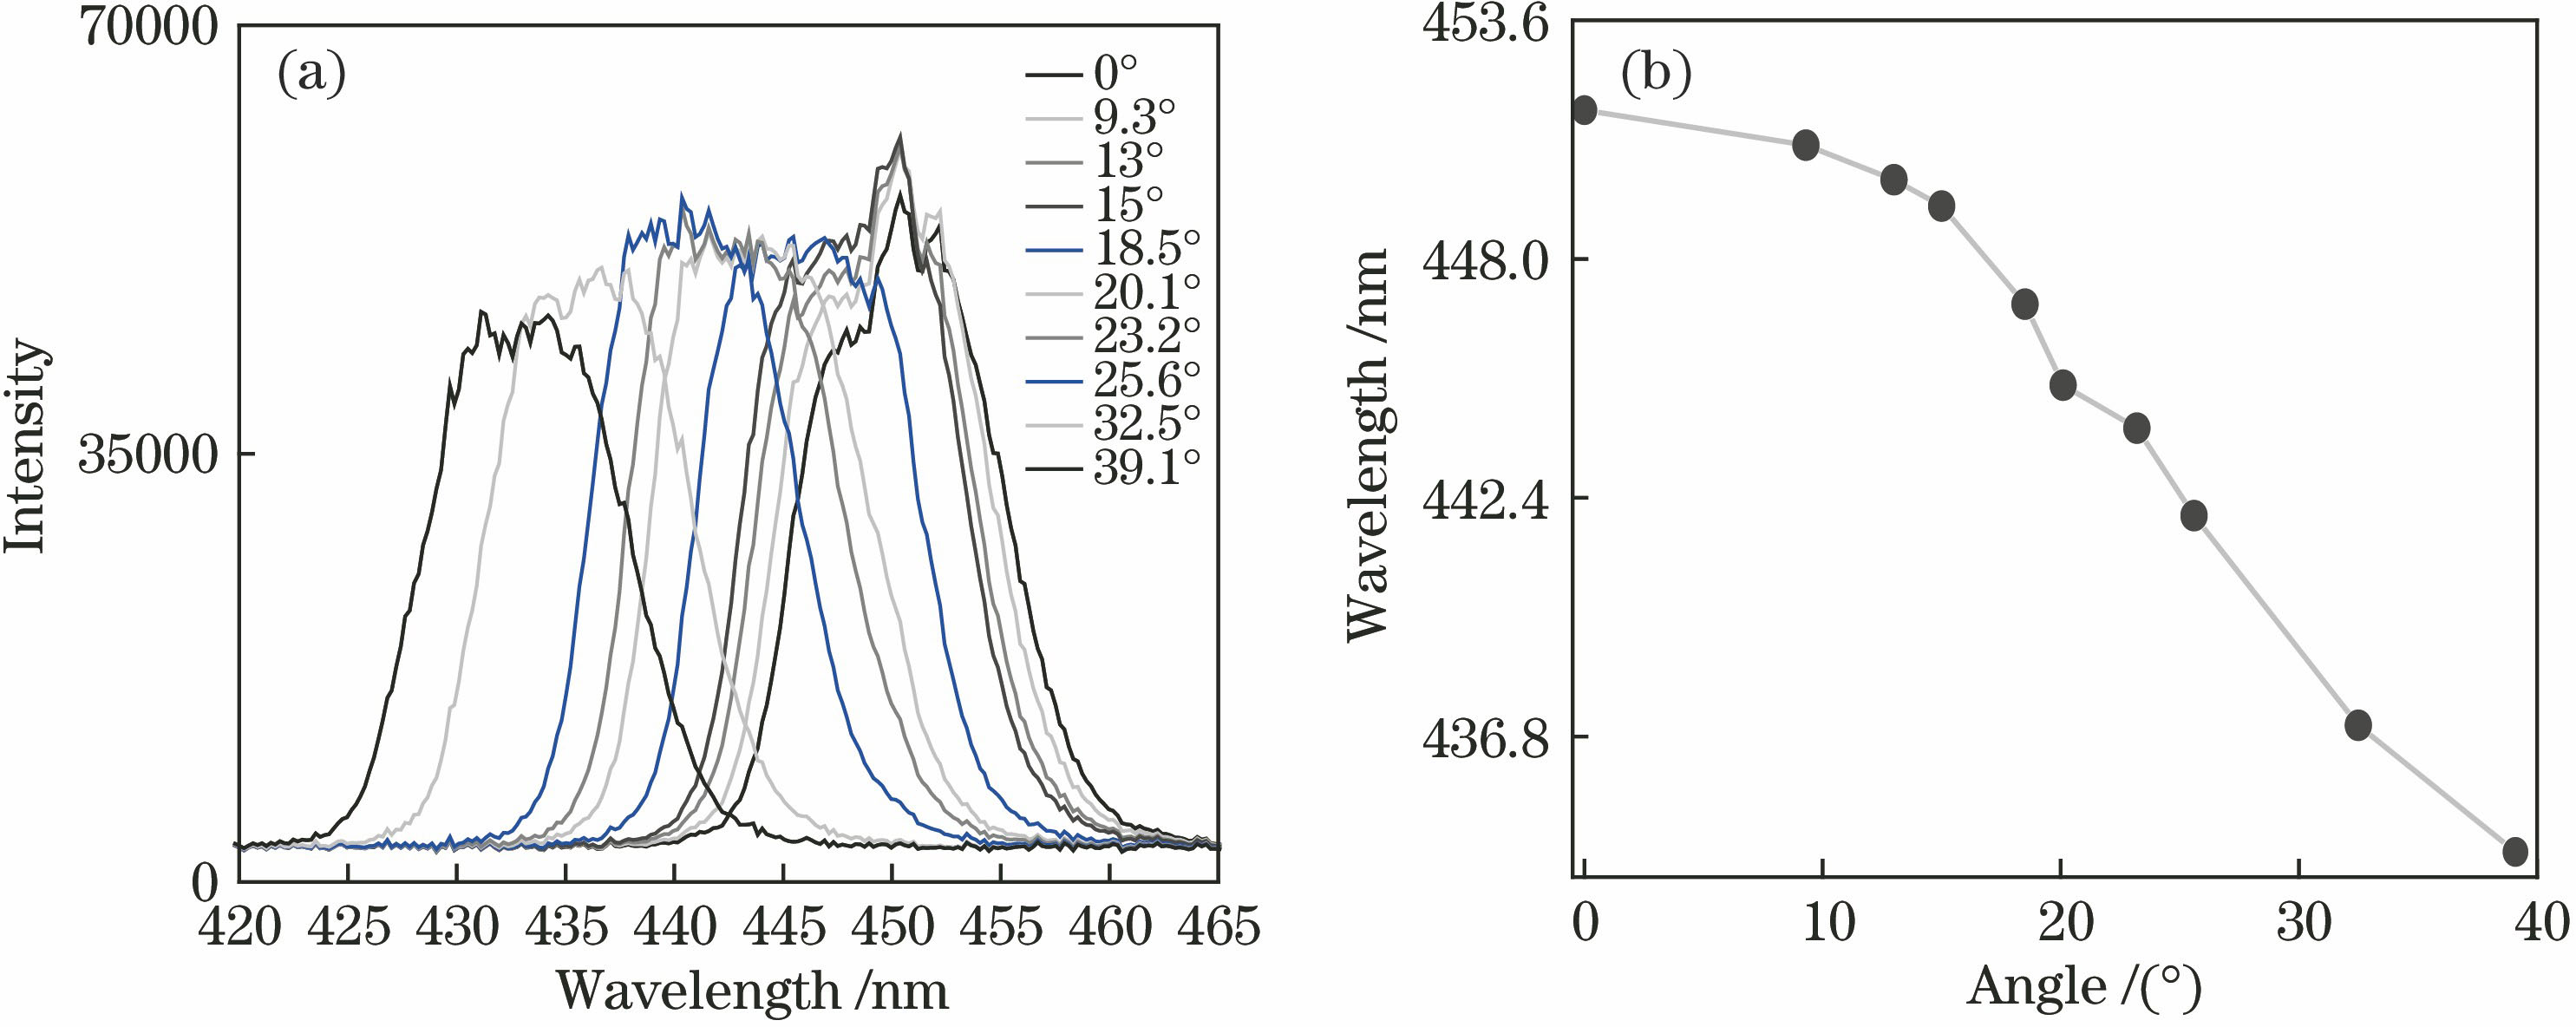
Fig. 2. Relationship between central wavelength and incident angle. (a) Transmittance spectra; (b) curve of central wavelength versus incident angle
Fig. 3. Schematic of imaging system
Fig. 4. Absorption cross section of NO2 and H2O
Fig. 5. SNRs of three filters
Fig. 6. Plume maps under different exposure time. (a) 2 s; (b) 0.5 s
Fig. 7. SNR versus exposure time and number of superimposed images
Fig. 8. Relationship between column density of NO2 and optical density. (a) λc=458 nm, w1/2=2 nm; (b) λc=450 nm, w1/2=10 nm; (c) λc=450 nm, w1/2=40 nm
Fig. 9. Detection limits of filters
Fig. 10. Master maps. (a) λc=450 nm; (b) λc=600 nm
Fig. 11. Distributions of optical density and column density of NO2. (a) Optical density of filter with central wavelength of 450 nm; (b) optical density of filter with central wavelength of 600 nm; (c) differential optical density of NO2; (d) two-dimensional column density distribution of NO2
|
Table 1. Central wavelength of filter and its range of variation

Set citation alerts for the article
Please enter your email address
© Copyright 2018-2021 | Chinese Laser Press. All Rights Reserved 沪ICP备15018463号-20